 CryptoChain Blog
Introduction to DeFi Statistical Arbitrage in 2026
Statistical arbitrage in DeFi has evolved significantly by 2026, leveraging on-chain data for precise pair trading strategies. Traders now combine cointegration analysis with real-time signals to exploit temporary price divergences between correlated assets like ETH and staked variants or major lending tokens. This data-driven method allows participants to capture small but consistent edges across decentralized exchanges without relying on directional market bets.
The core idea remains mean reversion: when two assets with a stable long-term relationship diverge, the spread is expected to close. On-chain tools provide transparent metrics unavailable in traditional markets, offering an edge for those who master the data. In practice, successful strategies integrate statistical rigor with blockchain-specific considerations such as gas costs, liquidity fragmentation, and smart contract risks.
Selecting Correlated DeFi Assets for Pair Trading
Effective pair trading starts with identifying assets that exhibit cointegration rather than simple correlation. Use statistical tests such as the Augmented Dickey-Fuller on price series from sources like Dune Analytics to confirm long-term equilibrium relationships. Popular pairs in 2026 include ETH/USDC liquidity positions, wstETH/stETH, and governance tokens from major protocols. Focus on assets with overlapping liquidity pools on DEXes to minimize basis risk and ensure reliable execution.
When selecting pairs, examine factors including shared underlying protocols, similar tokenomics, and overlapping user bases. For example, liquid staking derivatives often display strong cointegration because their prices are anchored to the same base asset. Avoid pairs that appear correlated only during specific market regimes, as these frequently break down during volatility spikes.
Understanding Cointegration Tests and Mean-Reversion Signals
Cointegration testing goes beyond Pearson correlation by confirming that a linear combination of two price series remains stationary over time. The Engle-Granger two-step method or Johansen test are commonly applied using on-chain price feeds. Once cointegration is established, traders calculate the spread and monitor its z-score to identify statistically significant deviations.
Mean-reversion signals are refined by layering additional on-chain indicators such as changes in total value locked, unique wallet activity, and cross-protocol flows pulled from Nansen. These filters help distinguish genuine arbitrage opportunities from noise caused by temporary sentiment shifts.
Building Entry and Exit Rules
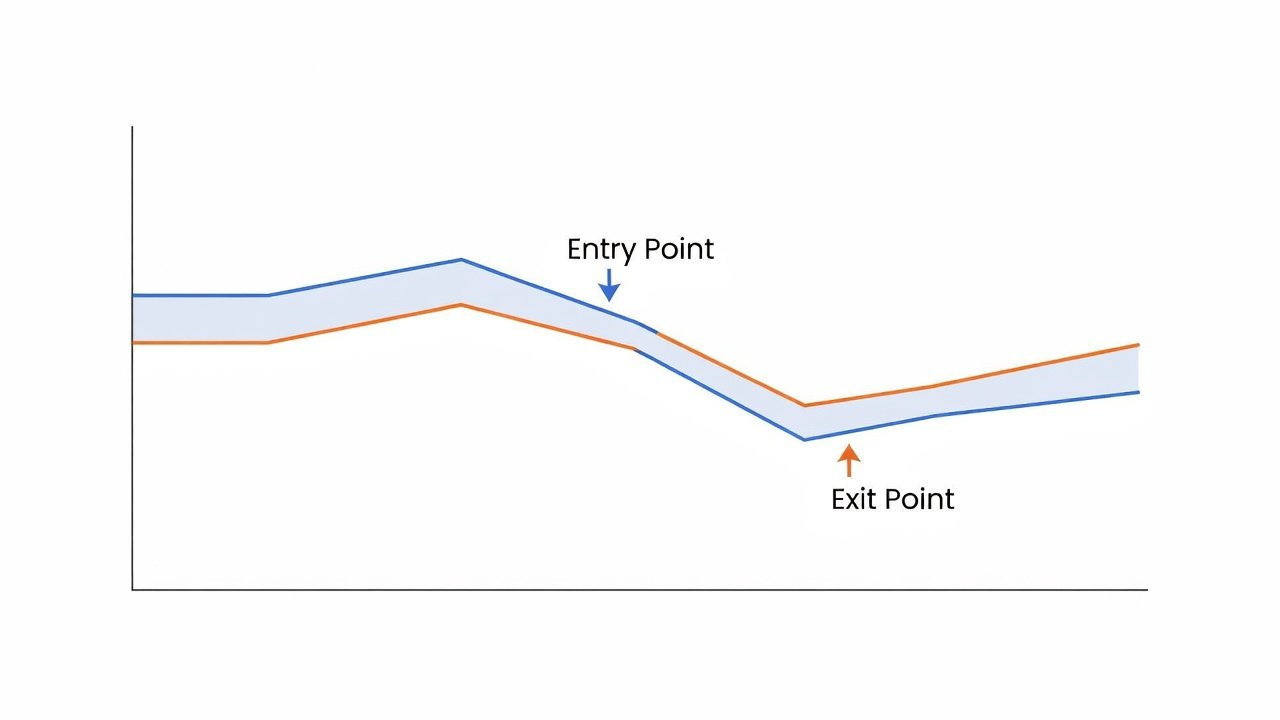
Entry signals trigger when the spread between paired assets exceeds two standard deviations from the mean. Exit occurs upon reversion to within 0.5 standard deviations or at a predefined time stop of 48 hours. Position sizing should account for current pool depth and estimated slippage to preserve expected returns.
Practical rules also incorporate volume-weighted average price checks and minimum liquidity thresholds. Traders often maintain a ruleset that requires at least three confirming on-chain signals before committing capital, reducing the impact of isolated data anomalies.
Automating Alerts with Custom Scripts
Develop Python scripts using libraries like statsmodels for cointegration checks and Web3.py for blockchain queries. Set up alerts via webhooks when spreads breach thresholds, integrating with Telegram or Discord for instant notifications. Scripts should poll data every 15 minutes during high-volatility periods and include slippage estimates before execution. Advanced implementations schedule backtests nightly to recalibrate parameters as market conditions evolve.
Managing Slippage on DEXes Like Uniswap V4
Uniswap V4 introduces hooks that allow custom logic for better execution. Traders mitigate slippage by splitting large orders, using limit orders via aggregators, or timing entries during low-gas periods. Always simulate trades with current pool depths to avoid unexpected costs that erode arbitrage profits. Monitoring real-time gas prices and choosing optimal block times further improves net performance.
Step-by-Step Examples of Live Trades
Consider a live example with wstETH and stETH: Query historical prices from on-chain oracles, run the Engle-Granger test to verify cointegration, and monitor the z-score continuously. When the spread widens beyond the entry threshold, enter the long-short position via a DEX aggregator while logging gas fees and actual fill prices. Monitor the position until mean reversion completes the cycle, then exit and record performance metrics for later review.
Another example involves ETH and a major lending token pair. The process begins with data extraction, proceeds through signal validation, and ends with automated execution scripts that incorporate circuit breakers. Documenting each step including failed attempts builds a valuable internal knowledge base.
Risk Filters for Black-Swan Events
Implement strict risk controls such as position sizing limited to a small percentage of portfolio and circuit breakers that pause trading during extreme volatility spikes detected on-chain. Monitor for protocol exploits or sudden liquidity drains using alerts from multiple data providers. Additional layers include maximum drawdown limits and mandatory cooling-off periods after consecutive losing trades.
Centralized vs On-Chain Data Sources Comparison
- Centralized exchanges offer deeper historical data but introduce custody risks and potential information asymmetry.
- On-chain sources provide real-time transparency and verifiable metrics but require robust parsing tools and can suffer from latency during network congestion.
- Hybrid models using both often yield the best results for 2026 strategies by combining breadth with immediacy.
Backtesting Frameworks and Common Pitfalls
Build backtests with frameworks like Backtrader or custom Jupyter notebooks pulling data from Uniswap subgraphs. Test across multiple market regimes including bull runs, bear markets, and sideways conditions to ensure robustness. Walk-forward optimization helps prevent overfitting.
Common failures include overfitting to past data, ignoring transaction costs, neglecting regime shifts, and underestimating smart contract risks. Over 80% of retail attempts fail due to inadequate risk management and poor data quality. Traders should also avoid cherry-picking only successful backtest periods and must validate results on out-of-sample data.
Scaling Strategies Safely in 2026 Market Conditions
Scaling requires gradual position size increases only after consistent live performance over several months. Maintain diversified pairs, regularly update cointegration parameters, and incorporate new on-chain metrics as protocols evolve. Always reserve capital buffers for unexpected events such as regulatory changes or major protocol upgrades.
Conclusion
DeFi statistical arbitrage remains viable in 2026 when executed with rigorous on-chain analysis and disciplined rules. Continuous learning, robust automation, and strict risk controls separate successful practitioners from the majority who abandon strategies after early setbacks.
FAQ
How safe is scaling these strategies in 2026? Start small, use testnets for validation, and gradually increase size only after consistent live results across varied market conditions.
What tools are essential? Dune Analytics, Nansen, custom Python scripts, and DEX aggregators form the core stack for most practitioners.
Can beginners succeed? Foundational statistics knowledge and coding experience are required before attempting live trading; starting with paper trading is strongly recommended.
How often should parameters be recalibrated? Review cointegration relationships monthly and adjust thresholds whenever major protocol changes or liquidity shifts occur.


No comments yet. Be the first!