 CryptoChain Blog
Introduction to 2026 Ethereum L2 Landscape
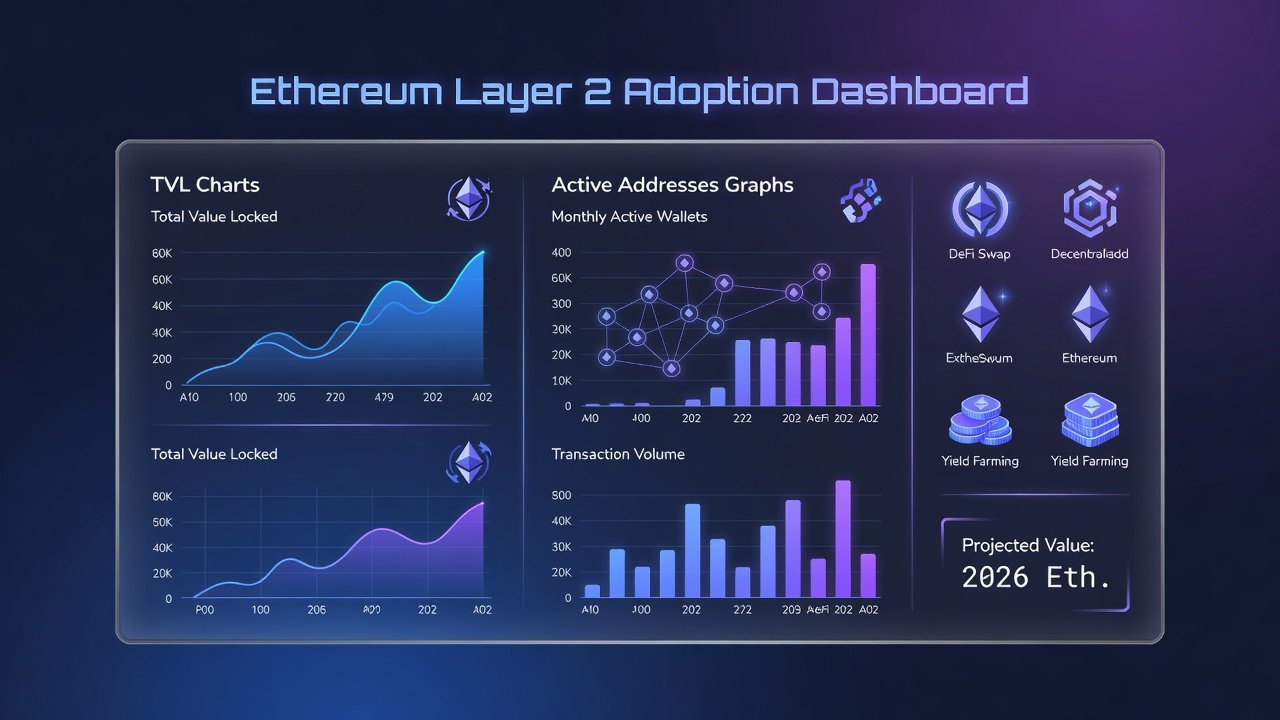
As Ethereum continues its evolution in 2026, Layer 2 solutions have become central to scaling the network and unlocking mainstream usage. Adoption metrics such as Total Value Locked (TVL), active addresses, and transaction volumes reveal strong growth driven by institutional interest, developer activity, and ecosystem expansions. These indicators go beyond surface-level hype to show real user engagement and capital commitment across the ecosystem. This comprehensive guide examines these trends in depth, offering side-by-side comparisons across leading L2s, analysis of DeFi integrations, and practical guidance for investors seeking data-driven decisions in a rapidly maturing market.
Key L2 Adoption Metrics in Focus
Understanding L2 performance requires analyzing core indicators that together paint a complete picture of network health. TVL measures capital committed to protocols and serves as a liquidity benchmark. Active addresses track unique user engagement over time, highlighting retention and organic growth. Transaction volume highlights network activity, fee generation, and overall throughput. These metrics collectively signal adoption velocity beyond simple price movements and help distinguish sustainable growth from temporary spikes. For example, a rise in TVL paired with increasing active addresses often indicates genuine utility rather than speculative inflows alone.
TVL Trends Across Major L2s
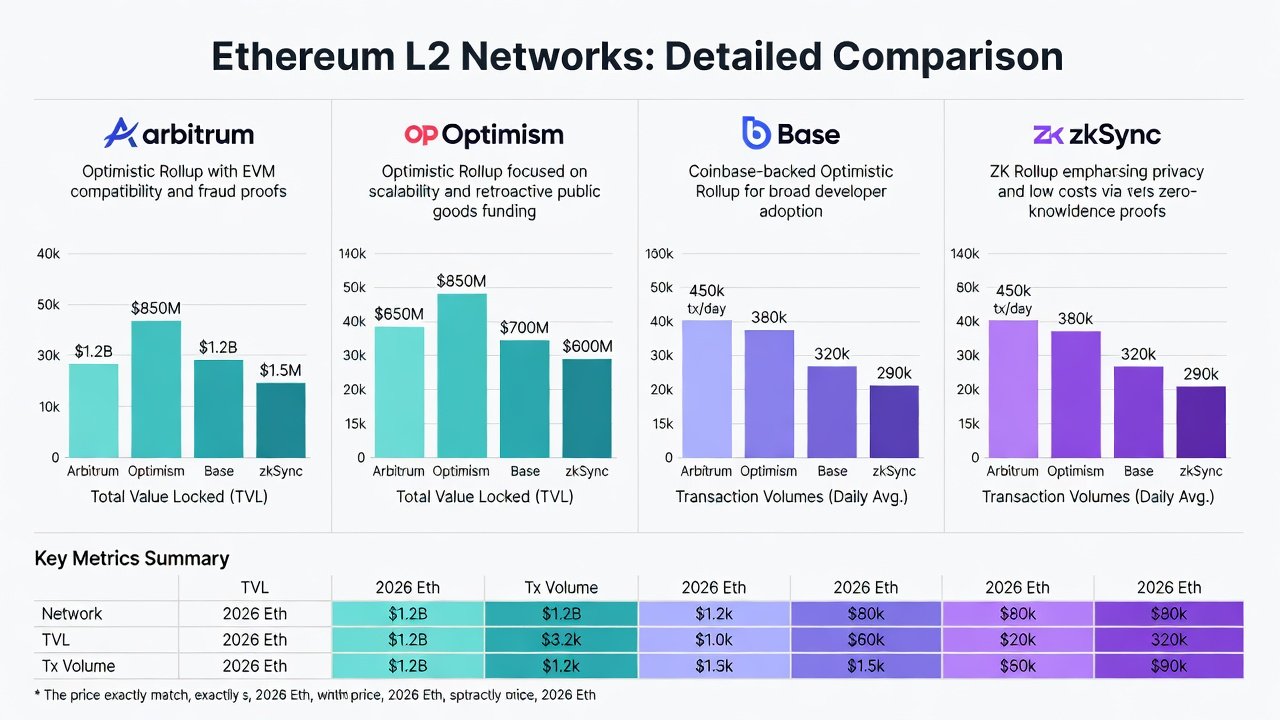
Leading L2s like Arbitrum, Optimism, Base, and zkSync have shown differentiated growth patterns throughout 2026. Arbitrum often leads in TVL due to its established DeFi ecosystem and robust perpetuals markets. Base benefits from seamless Coinbase integration, driving retail inflows and consistent week-over-week TVL increases. Optimism emphasizes governance innovations and public goods funding, attracting long-term developer communities. Data from authoritative sources such as DefiLlama provides real-time visibility into these figures and allows investors to filter by chain, protocol category, and time period for precise comparisons.
Active Addresses and User Engagement
Active addresses serve as a reliable proxy for genuine usage and ecosystem stickiness. In 2026, networks with strong DeFi integrations report higher daily active addresses, reflecting repeat interactions in lending, trading, and yield farming. This metric helps identify which L2s are moving beyond initial hype toward habitual use. Investors should watch for correlations between address growth and TVL stability, as sudden spikes without corresponding volume increases may signal wash trading or bot activity.
DeFi Integrations Driving L2 Growth
DeFi protocols on L2s enable dramatically lower fees and faster settlements compared to Ethereum mainnet, unlocking strategies that were previously cost-prohibitive. Integrations with established platforms like Aave, Uniswap, and Pendle have accelerated adoption by creating powerful flywheel effects where liquidity attracts more users, which in turn draws additional developers and capital. These integrations also support advanced features such as concentrated liquidity positions and automated yield optimization, further enhancing user experience and capital efficiency across the board.
Comparisons of Major L2 Ecosystems
- Arbitrum: Strong in perpetuals and lending protocols with mature tooling and developer grants that foster continuous innovation.
- Optimism: Focus on governance and public goods funding attracts developer communities and long-term ecosystem builders.
- Base: Rapid retail adoption via seamless onboarding from centralized exchanges and consumer-facing applications.
- zkSync: Emphasis on zero-knowledge proofs for enhanced security, scalability, and privacy-preserving DeFi applications.
Growth Drivers: Institutional Flows and Expansions
Institutional capital flows into L2s via tokenized real-world assets, enterprise pilots, and treasury management solutions. Ecosystem expansions, including new rollup deployments, improved cross-chain bridges, and modular infrastructure upgrades, further amplify reach and interoperability. Official resources from Ethereum.org detail ongoing protocol upgrades supporting these trends and provide technical roadmaps that investors can reference when evaluating long-term viability.
Step-by-Step Guide to Tracking L2 Metrics
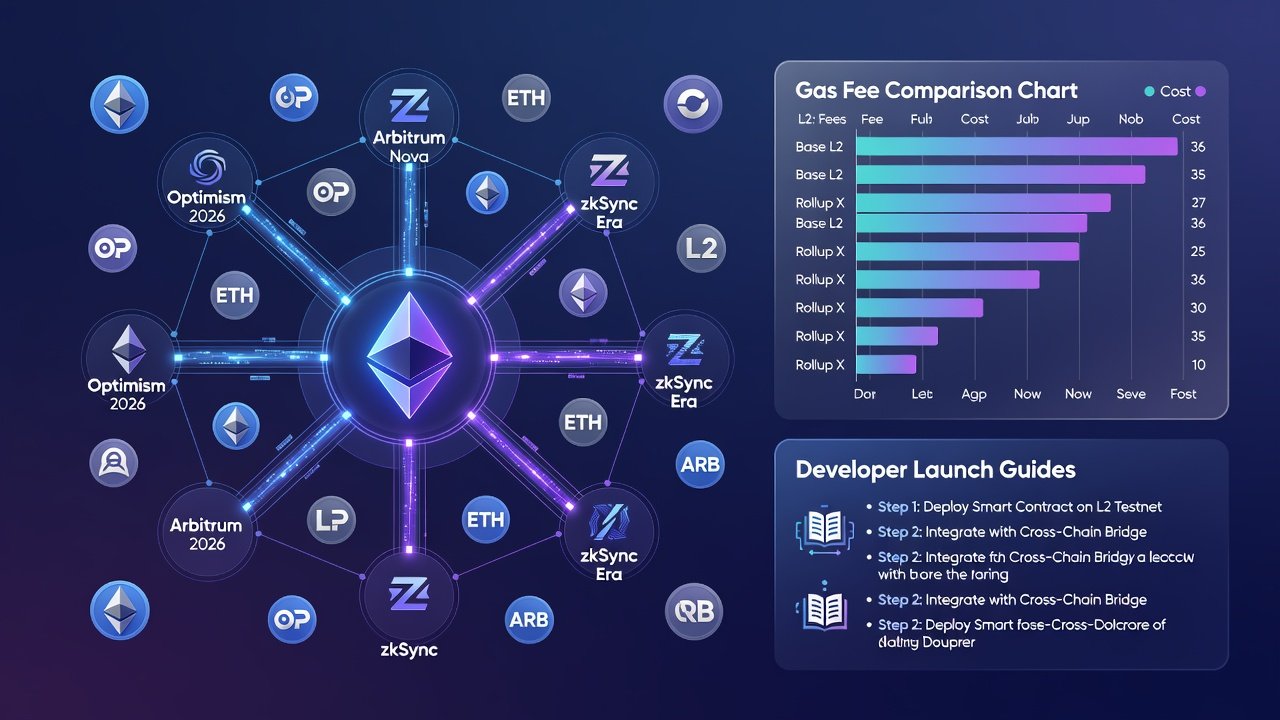
Investors can monitor these metrics effectively using free and professional dashboards. Begin by visiting L2Beat for standardized TVL and activity rankings across all major rollups. Next, navigate to Dune Analytics for custom SQL queries that surface active addresses, transaction volumes, and user retention curves. Cross-reference DefiLlama for protocol-specific breakdowns and historical trends. Set automated alerts for threshold breaches in key metrics such as weekly TVL changes or address growth rates. Finally, review weekly reports from ecosystem foundations for qualitative context that raw numbers alone cannot provide. This disciplined approach helps investors separate signal from noise and make informed allocation decisions.
Common Pitfalls When Interpreting L2 Data
Many investors overlook liquidity fragmentation across bridges or fail to account for sequencer centralization risks when evaluating L2s. Another frequent mistake is relying solely on TVL without verifying active address quality or sustainable revenue generation. Always cross-check multiple data sources and consider both quantitative metrics and qualitative factors such as team execution and community governance health before committing capital.
Future Projections for L2 Adoption
Analysts anticipate continued expansion through 2027 and beyond as Ethereum's prior upgrades deliver compounding benefits. Risks include bridge vulnerabilities, regulatory shifts, and competition from alternative layer-1 chains. Opportunities lie in modular blockchain architectures, AI-integrated DeFi applications, and expanding real-world asset tokenization on L2 rails. Staying informed through reliable dashboards and community channels positions investors to capitalize on emerging trends while managing downside exposure.
FAQ on L2 Adoption Risks and Opportunities
What are the main risks of L2 adoption?
Key risks involve smart contract vulnerabilities, liquidity fragmentation across multiple chains, and potential centralization in sequencers. Diversification across multiple L2s and careful due diligence on bridge security help mitigate these concerns effectively.
How do L2s enhance DeFi opportunities?
Lower transaction costs enable smaller trades, complex strategies, and frequent interactions that were previously uneconomical on mainnet. This unlocks new yield sources, retail participation, and innovative product development at scale.
Are institutional flows sustainable long term?
Yes, as regulatory clarity improves and infrastructure matures, institutions increasingly view L2s as essential infrastructure for digital asset management, settlement, and tokenized fund operations.
What metrics should retail investors prioritize first?
Start with TVL stability, daily active addresses, and protocol revenue. These three indicators together reveal both capital commitment and real usage more reliably than any single metric in isolation.
Conclusion
2026 marks a pivotal year for Ethereum L2 adoption, with metrics underscoring robust growth and deepening DeFi synergies. By leveraging comprehensive dashboards, understanding cross-L2 comparisons, and avoiding common analytical pitfalls, investors can position themselves strategically in this evolving landscape and capture meaningful opportunities while navigating inherent risks with greater confidence.
No comments yet. Be the first!