 CryptoChain Blog
Introduction to Ethereum L2 Institutional Adoption in 2026
As Ethereum matures into a global settlement layer, Layer 2 solutions have moved from experimental scaling tools to core infrastructure for institutional finance. In 2026 investors and treasury teams are closely monitoring precise on-chain metrics including total value locked, active addresses, and transaction volumes to identify networks with genuine adoption momentum. This analysis goes beyond basic overviews to deliver actionable frameworks that help investors interpret data signals and compare optimistic rollups against zero-knowledge alternatives.
Institutional participation has accelerated because L2 networks now offer the combination of lower fees, faster finality, and enterprise-grade security that traditional finance requires. Banks, asset managers, and hedge funds are executing structured migrations rather than small pilots. Understanding the underlying metrics allows decision-makers to separate sustainable growth from temporary liquidity spikes.
TVL Breakdowns and Key Metrics for 2026
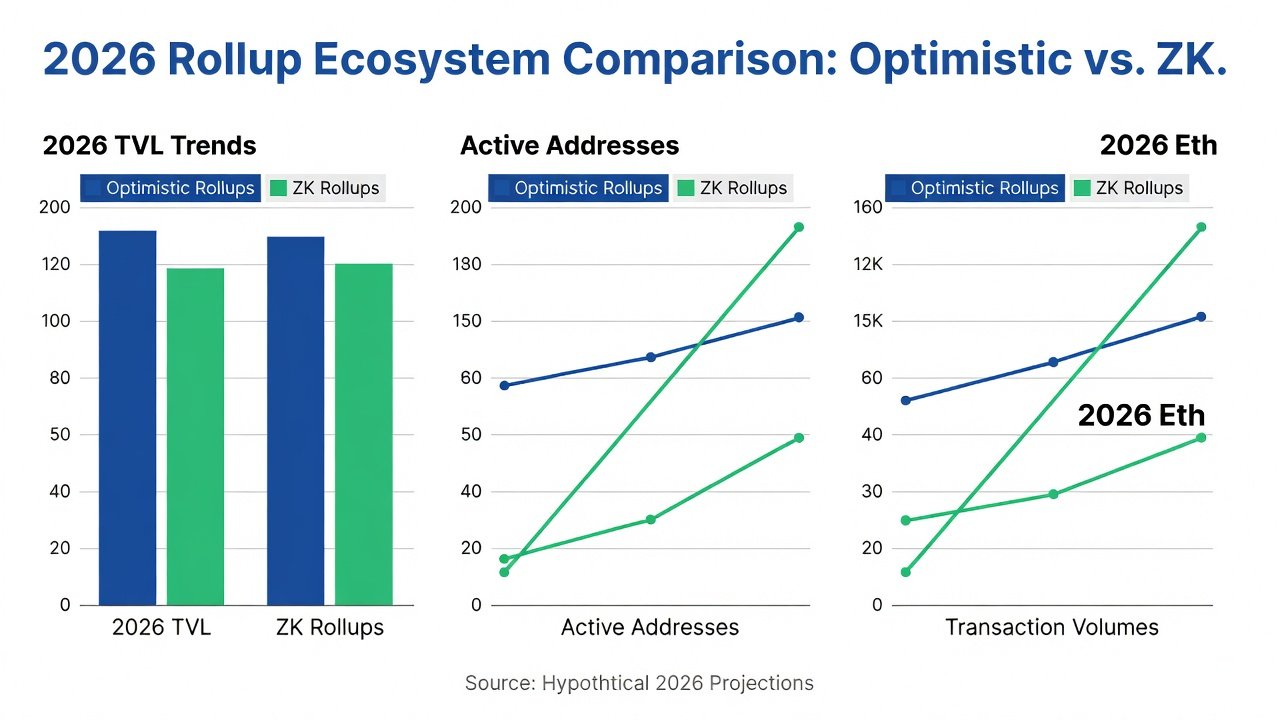
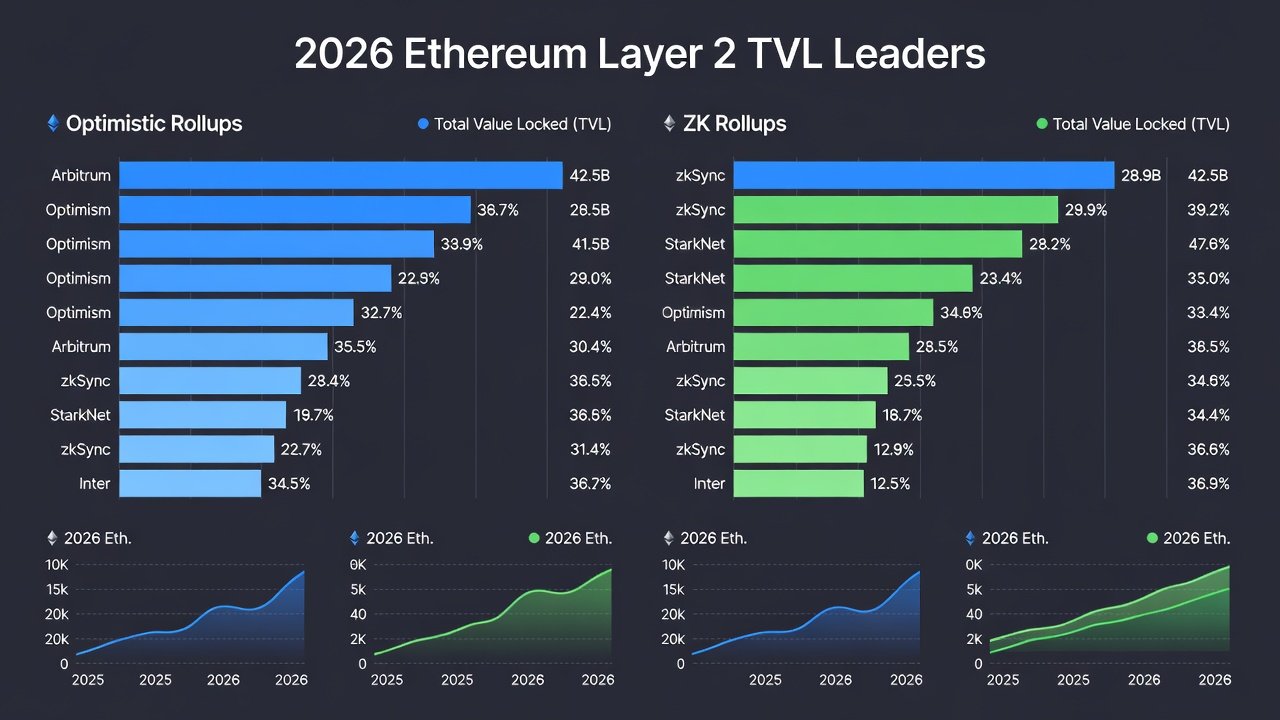
Total value locked remains the headline metric for institutional confidence, yet it must be examined alongside active addresses and daily transaction counts to reveal true usage patterns. Optimistic rollups continue to hold significant TVL share because of mature developer tooling and broad EVM compatibility, while ZK rollups are closing the gap through cryptographic security advantages and near-instant withdrawals. Breaking down TVL by category shows that stablecoin and tokenized asset deposits dominate institutional flows, whereas retail-driven protocols contribute more variable liquidity.
Active address growth provides a clearer picture of organic demand. When new addresses from known institutional custodians increase steadily, it often precedes larger TVL inflows. Transaction volume analysis further refines the picture: high average transaction values combined with consistent daily counts typically indicate settlement activity from trading desks and treasury operations rather than speculative trading.
Optimistic vs ZK Rollups: Detailed Comparison
The architectural differences between optimistic and ZK rollups create distinct risk and performance profiles for institutions. Optimistic rollups assume transactions are valid by default and rely on fraud proofs during a challenge window, which introduces a delay before funds can exit. This model supports complex smart contract interactions and benefits from extensive audit history across major protocols.
ZK rollups, by contrast, generate validity proofs for every batch, enabling immediate finality and stronger privacy guarantees. Institutions handling regulated assets often prefer ZK solutions because they reduce counterparty risk during the withdrawal period. Performance benchmarks in 2026 show ZK networks achieving higher throughput under sustained load while maintaining lower variance in gas costs.
Key comparison points include:
- Security assumptions and proof verification costs
- Withdrawal latency and capital efficiency for large positions
- Compatibility with existing custody and compliance tooling
- Historical uptime and incident response records
- Support for institutional features such as account abstraction and multi-sig governance
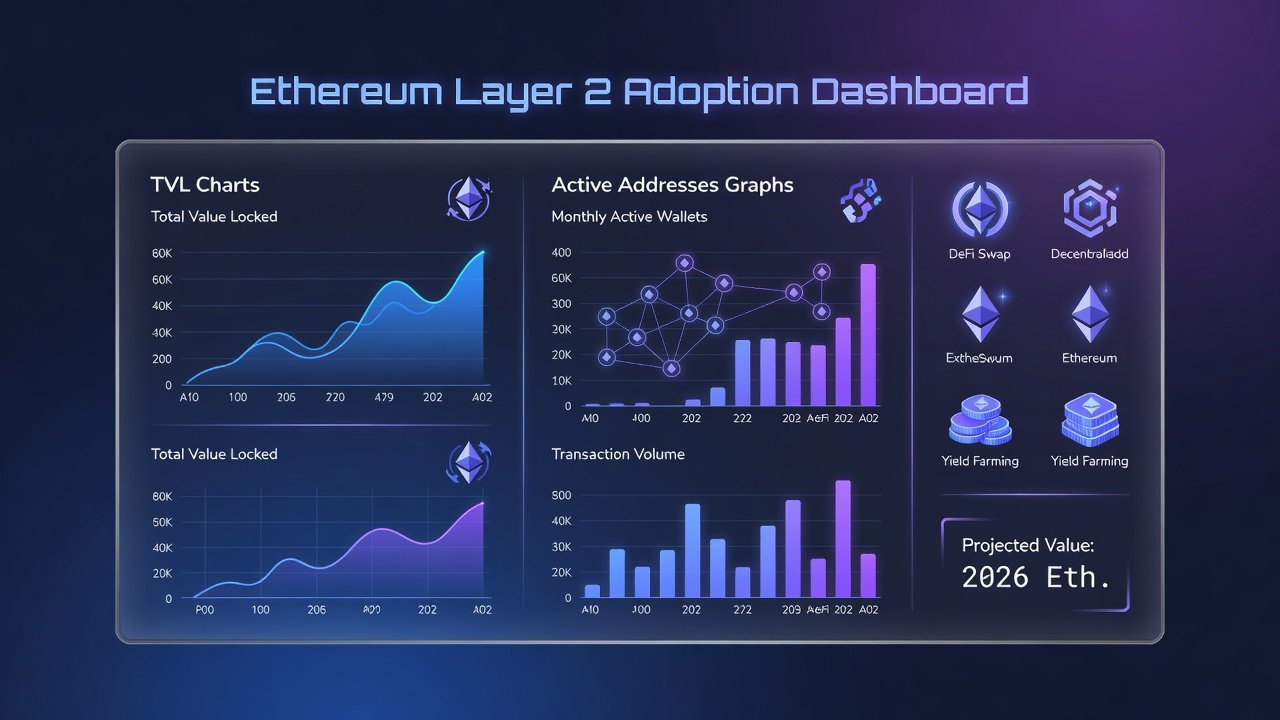
Investors should review public dashboards that aggregate these metrics across both rollup types for ongoing evaluation.
TradFi Integration Examples from Banks and Funds
Global banks have begun integrating Ethereum L2 networks for cross-border settlement and collateral management. Several European and Asian institutions now route tokenized bond settlements through L2 bridges connected to their existing custody platforms. Asset managers are deploying portions of fixed-income portfolios into L2-based yield strategies that maintain on-chain transparency while satisfying regulatory reporting requirements.
Hedge funds focused on quantitative strategies use L2s for high-frequency rebalancing because of predictable gas economics and sub-second finality on leading ZK networks. These integrations typically involve dedicated oracle feeds, compliance oracles, and real-time monitoring dashboards shared between the institution and the L2 operator.
Step-by-Step Institutional Migration Guide
A structured migration process reduces operational and regulatory risk. Institutions should follow these expanded steps:
- Map current custody architecture and identify regulatory jurisdictions that apply to on-chain assets
- Conduct a quantitative comparison of candidate L2s using TVL concentration, active address quality, and security audit status
- Establish testnet environments and execute end-to-end transaction flows with internal compliance teams
- Define key performance indicators such as maximum acceptable latency and minimum liquidity depth before scaling positions
- Implement multi-signature governance and automated alerting tied to on-chain metric thresholds
- Document all bridge and oracle dependencies for audit trails
Each step should include sign-off from legal, technology, and risk committees to ensure alignment with institutional policies.
Network Performance Benchmarks
Institutional workloads demand consistent performance under variable conditions. Leading optimistic rollups deliver thousands of transactions per second with finality measured in minutes, while advanced ZK implementations achieve similar throughput with finality under one minute. Latency, cost predictability, and uptime during network stress events remain the most relevant benchmarks for treasury operations. Publicly available analytics platforms allow continuous comparison of these indicators across networks.
Ethereum Foundation resources provide ongoing context on protocol upgrades that directly influence L2 performance roadmaps.
Step-by-Step Metric Analysis Guide for Investors
Effective analysis requires a repeatable process that combines multiple data sources. Follow this expanded guide:
- Aggregate TVL figures from several independent trackers over rolling 90-day windows and segment by asset class
- Filter active address data to remove exchange and bridge contracts, then track wallet age and interaction frequency
- Normalize transaction volume by average value to distinguish large institutional flows from retail activity
- Build time-series visualizations that overlay TVL growth with address and volume trends
- Correlate metric movements with public announcements from banks and funds to validate adoption signals
- Establish alert thresholds for sudden drops in active addresses or volume that may indicate liquidity migration
This disciplined approach surfaces genuine institutional momentum while filtering noise.
Data Visualization Tips
Strong visualizations combine multiple chart types for clarity. Use stacked area charts to show TVL composition across optimistic and ZK categories, paired with dual-axis line charts for active addresses and transaction volume. Color coding should remain consistent across all dashboards, with optimistic rollups in one hue family and ZK rollups in another. Interactive filters allow stakeholders to drill down by asset type or time period. Always source underlying data from reputable on-chain analytics platforms and include last-updated timestamps on every visualization.
FAQs on Selecting L2s Based on Adoption Signals
How should investors interpret rising TVL with stagnant active addresses?
This pattern frequently reflects large single-entity deposits rather than broad adoption. Review transaction size distributions and wallet clustering to determine whether activity originates from institutions or concentrated liquidity providers.
Do optimistic or ZK rollups offer superior security for regulated assets?
ZK rollups provide stronger cryptographic assurances and eliminate the challenge period, making them preferable for assets subject to strict custody rules. Optimistic rollups have compensated with extensive battle-testing and additional security layers over multiple years.
What performance metrics matter most for high-frequency trading desks?
Consistent sub-second latency, predictable gas pricing, and high throughput during peak volatility periods are the primary considerations. Institutions should test these conditions on testnets before committing material capital.
How can teams monitor L2 health beyond TVL?
Track sequencer uptime, proof generation times, bridge liquidity depth, and governance participation rates. Combining these indicators with TVL and address metrics creates a comprehensive health score.
Should migration decisions rely solely on current adoption metrics?
Metrics provide essential signals but must be weighed against security history, roadmap credibility, and alignment with internal compliance frameworks. A holistic evaluation prevents over-reliance on any single data point.
Conclusion
Ethereum L2 institutional adoption in 2026 is best evaluated through rigorous, multi-metric analysis rather than headline TVL figures alone. By applying the comparison frameworks, migration steps, and visualization techniques described above, investors can identify networks with durable institutional traction. Continued reference to authoritative data sources such as DefiLlama and L2Beat ensures strategies remain grounded in the latest on-chain evidence. Institutions that implement disciplined metric analysis today will be positioned to capture the next wave of Layer 2 opportunities with greater confidence and lower risk.
No comments yet. Be the first!