 CryptoChain Blog
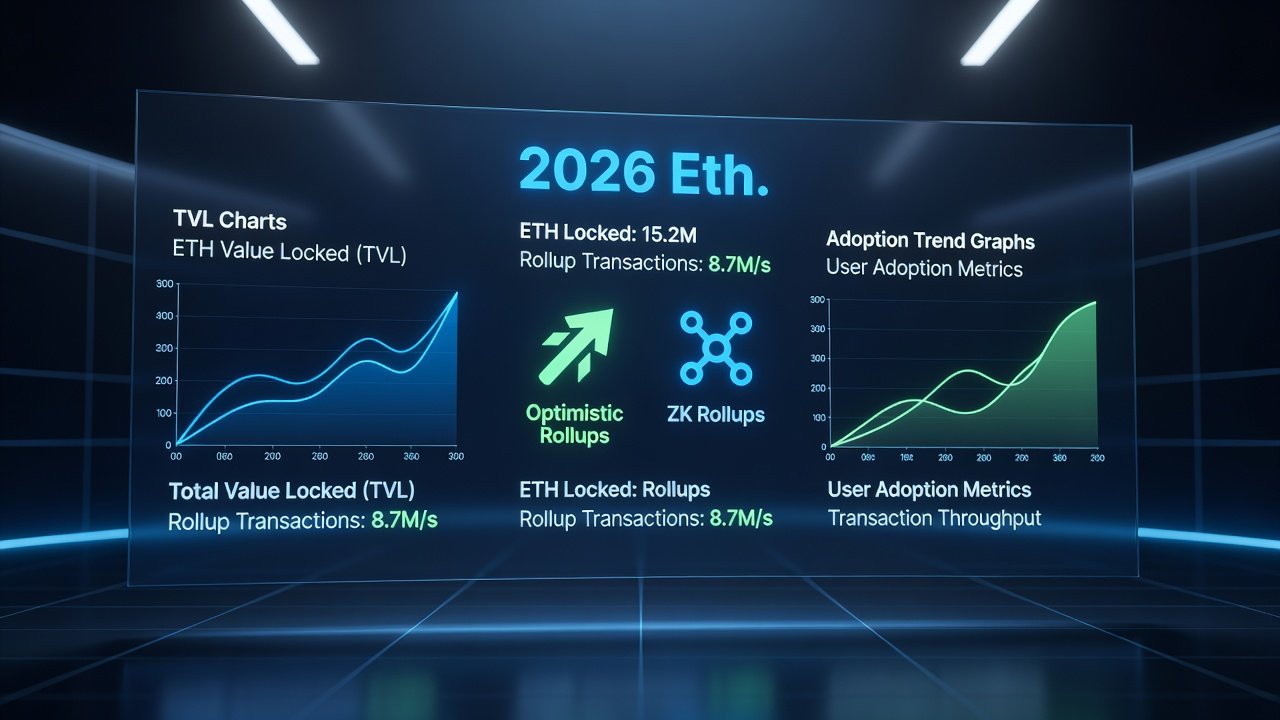
Introduction to 2026 Ethereum Layer 2 Metrics
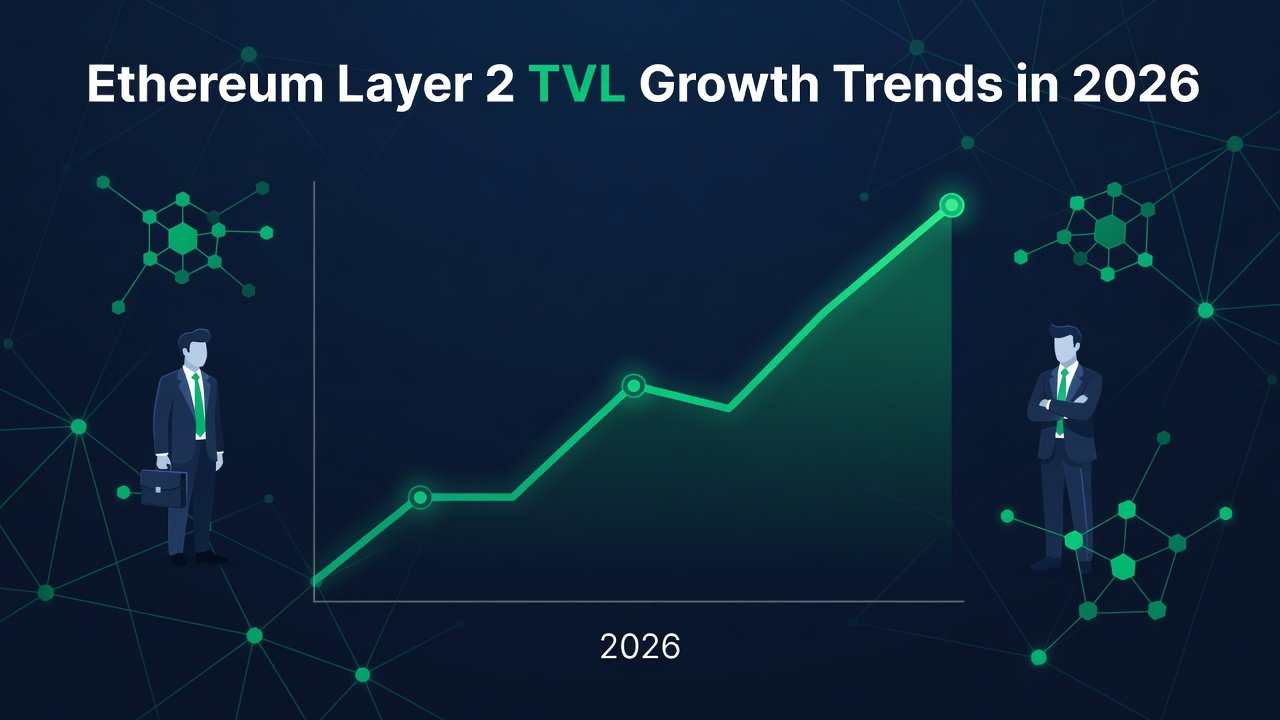
As Ethereum continues to scale in 2026, Layer 2 solutions have become central to network growth and usability. This comprehensive guide examines key metrics including total value locked (TVL) trends, daily active users, and inflows from traditional finance. Investors and analysts seeking actionable insights will learn how to interpret these figures for portfolio decisions rather than relying on raw numbers alone. Ethereum L2s address the base layer's limitations in speed and cost, enabling broader adoption across decentralized finance, gaming, and real-world asset tokenization.
Understanding TVL Breakdowns: Optimistic vs ZK Rollups
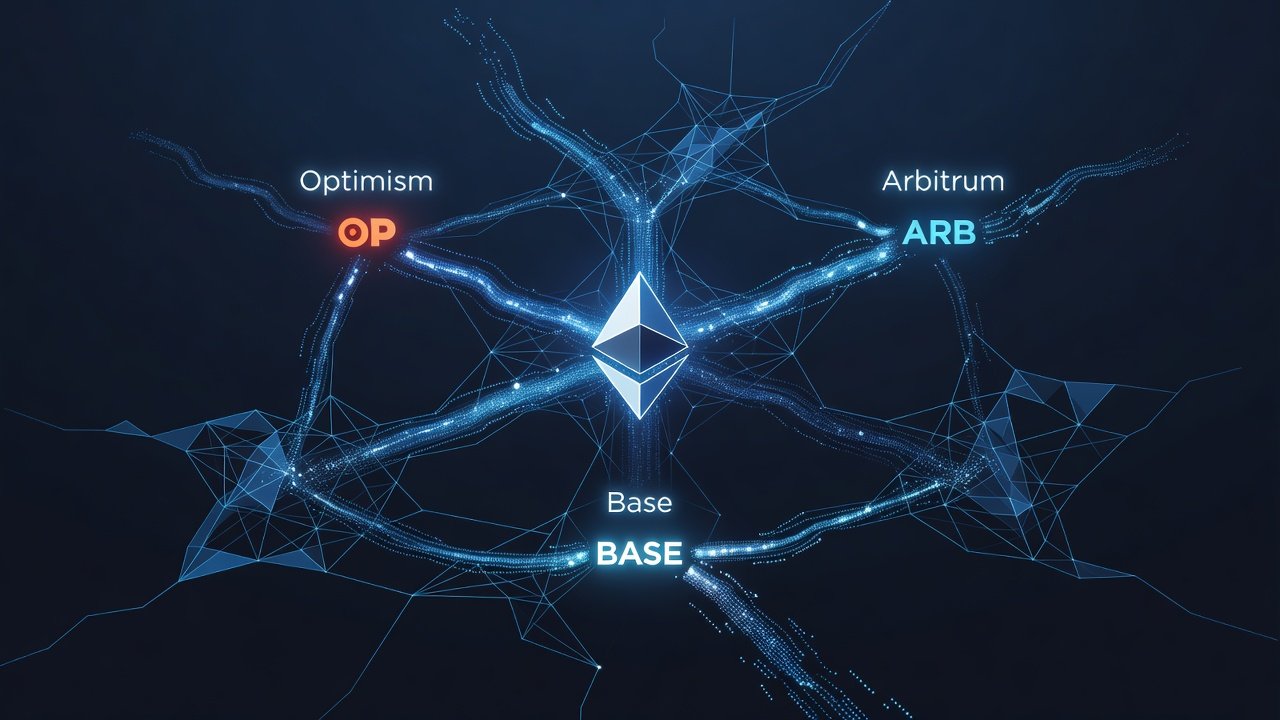
TVL remains a primary indicator of L2 health and ecosystem maturity. Optimistic rollups like Optimism and Arbitrum emphasize ease of deployment and EVM compatibility, allowing developers to migrate applications quickly with minimal code changes. In contrast, ZK rollups such as zkSync and Starknet prioritize cryptographic security through validity proofs, offering immediate finality and potentially lower long-term operational costs. In 2026, ZK solutions have shown accelerated adoption due to improvements in proof generation efficiency and hardware acceleration. Market observers note that optimistic rollups still hold significant share in DeFi applications because of established liquidity pools and user familiarity. However, ZK variants are closing the gap rapidly in areas requiring high throughput, such as payments and complex computations. For example, a portfolio manager evaluating TVL shifts might notice that optimistic chains maintain higher absolute values in lending protocols while ZK networks attract new capital in privacy-focused use cases.
Daily Active Users and Network Adoption Trends
Daily active users (DAU) provide a clearer picture of real usage than TVL alone because they reflect genuine interaction rather than locked capital that may sit idle. Leading networks report steady increases in unique addresses interacting with dApps, with some ecosystems surpassing previous yearly highs through organic growth in social and entertainment applications. Retail segments drive volume in gaming and social applications, where low fees encourage frequent micro-transactions. Institutional activity concentrates in tokenized assets and lending protocols, where compliance features and custody integrations matter more than raw speed. Comparisons reveal that networks with strong developer ecosystems maintain higher retention rates over time, as repeated updates and grants programs keep builders engaged.
TradFi Inflows and Institutional Participation
Traditional finance inflows into Ethereum L2s have grown through secure bridges and compliant custody solutions offered by established financial institutions. Institutions favor networks with robust security audits, transparent governance, and regulatory clarity to meet fiduciary standards. This segment shows preference for ZK-based chains when handling large-scale settlements because of the stronger guarantees against fraud. Retail investors, by contrast, engage more frequently with optimistic rollups offering familiar EVM compatibility and a wider selection of yield-generating opportunities. Tracking these inflows requires monitoring both on-chain bridge activity and off-chain announcements from asset managers.
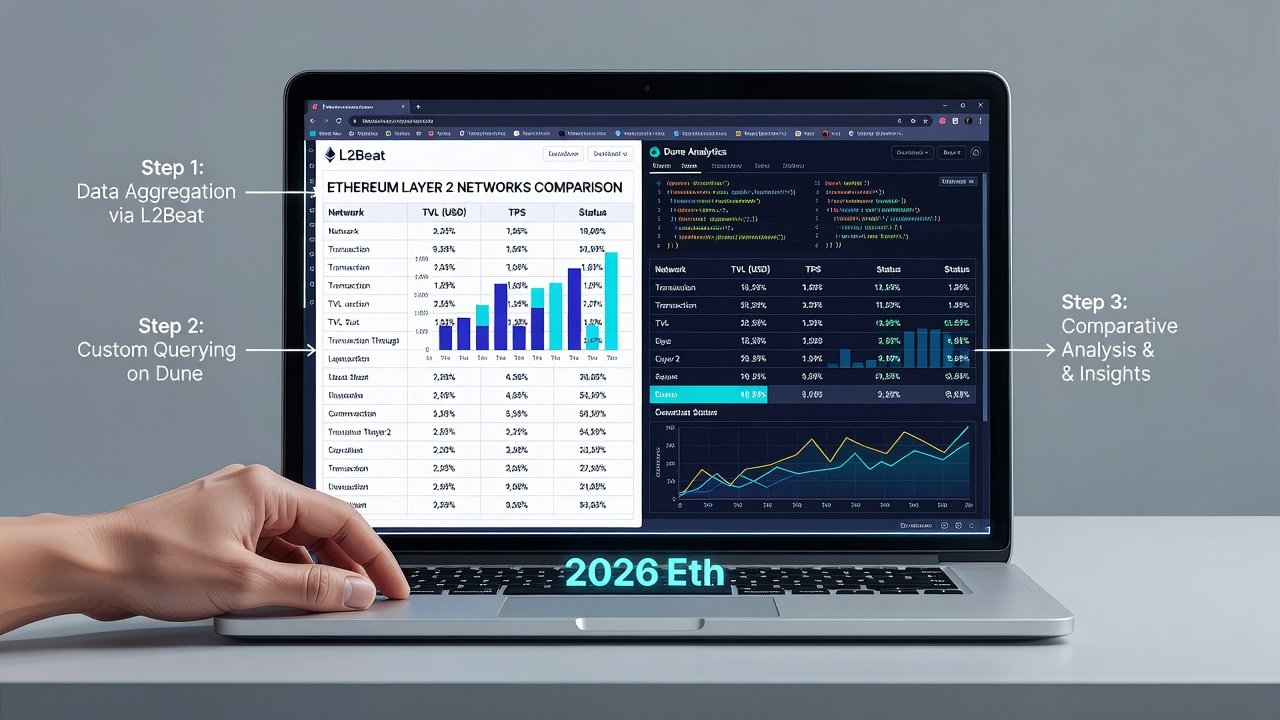
Step-by-Step Guide to Tracking Metrics with L2Beat
- Visit the L2Beat homepage and select the TVL overview tab to see aggregated figures across all tracked networks.
- Filter by rollup type to isolate optimistic and ZK categories, allowing side-by-side comparison of growth rates.
- Review historical charts for 30-day and 90-day trends while noting any sudden spikes that may coincide with major protocol launches.
- Export data in CSV format for custom portfolio analysis and integration with personal spreadsheets.
- Cross-reference activity metrics such as transaction counts to ensure TVL growth aligns with actual usage rather than temporary liquidity incentives.
Using Dune Analytics for Real-Time Insights
Dune Analytics allows creation of custom dashboards that go beyond static TVL snapshots. Start by querying Ethereum mainnet and L2 transaction tables to build visualizations for DAU and cross-chain inflows. Community dashboards often cover institutional wallet tracking, which can be forked and updated for personal use with additional filters for specific token contracts. Combine L2Beat data with Dune queries to validate TVL figures against on-chain activity and detect discrepancies caused by wrapped assets or bridged liquidity. Advanced users can create alerts for threshold breaches in daily active addresses, providing early signals of shifting adoption patterns.
Comparative Analysis of Leading L2 Networks
The following table summarizes key differences as observed in late 2026, highlighting how each network balances technical approach with user demographics:
| Network | Rollup Type | Primary Strength | Retail vs Institutional Balance | Example Use Case |
|---|---|---|---|---|
| Arbitrum | Optimistic | Ecosystem maturity | Balanced | Perpetual futures trading |
| Optimism | Optimistic | Developer tooling | Retail heavy | Gaming and social dApps |
| zkSync | ZK | Proof efficiency | Institutional tilt | Tokenized real-world assets |
| Starknet | ZK | Scalability | Growing institutional | High-frequency settlements |
These distinctions help investors understand why capital flows differently across networks and why monitoring both TVL and DAU provides a fuller picture.
Expert Predictions on Scaling Impacts
Analysts expect further compression of fees and expanded use cases in decentralized finance and real-world asset tokenization throughout the remainder of 2026. Scaling improvements could accelerate Ethereum's position as the settlement layer for multiple ecosystems, including cross-chain bridges and enterprise applications. Portfolio managers should monitor DAU growth as a leading indicator of sustainable adoption rather than short-term TVL spikes driven by incentives. Continued innovation in proof systems may also reduce operational costs for validators, indirectly benefiting end users through more competitive yield opportunities.
Common Mistakes to Avoid When Interpreting Metrics
- Relying solely on TVL without cross-referencing DAU, which can mask situations where capital is concentrated in a few large positions rather than broad participation.
- Ignoring bridge risks when assessing inflows, as temporary liquidity parked via bridges can inflate figures without reflecting organic demand.
- Overlooking differences between optimistic and ZK security models, leading to incorrect assumptions about finality times and dispute resolution.
- Failing to account for seasonal or event-driven fluctuations, such as those caused by major token unlocks or protocol upgrades.
Using Metrics to Inform Portfolio Decisions
Investors can integrate these metrics into decision frameworks by setting personal thresholds for minimum DAU growth alongside TVL stability. For instance, allocating to networks showing consistent month-over-month increases in active addresses while maintaining diversified exposure across optimistic and ZK categories reduces concentration risk. Regular review of Dune dashboards alongside L2Beat rankings ensures decisions remain grounded in current on-chain reality rather than outdated narratives.
Conclusion
Mastering 2026 Ethereum L2 metrics requires combining quantitative data with qualitative context. By leveraging tools like L2Beat and Dune Analytics, tracking institutional versus retail trends, and avoiding common interpretive pitfalls, readers can make more informed allocation choices in a rapidly evolving landscape.
FAQ
How do optimistic and ZK rollups differ in 2026?
Optimistic rollups assume transactions are valid by default and use fraud proofs for dispute resolution, while ZK rollups use validity proofs for immediate finality and enhanced security guarantees, making them suitable for different application types.
Which tools are best for real-time L2 tracking?
L2Beat offers reliable TVL dashboards with historical context, and Dune Analytics supports custom queries for deeper on-chain analysis including user behavior and inflow patterns.
Should investors prioritize institutional inflows?
Institutional activity often signals long-term stability and infrastructure improvements, but retail-driven usage frequently drives short-term volume and innovation, so both segments deserve attention in a balanced strategy.
What impact will scaling have on fees?
Continued improvements in rollup technology are expected to maintain low fees while increasing capacity for complex applications, benefiting both high-frequency traders and casual users.
How often should metrics be reviewed for portfolio adjustments?
Weekly reviews of key dashboards combined with monthly deeper analysis of trends provide a practical cadence that captures meaningful changes without overreacting to daily noise.
No comments yet. Be the first!