 CryptoChain Blog
Introduction to Ethereum L2 Metrics in 2026
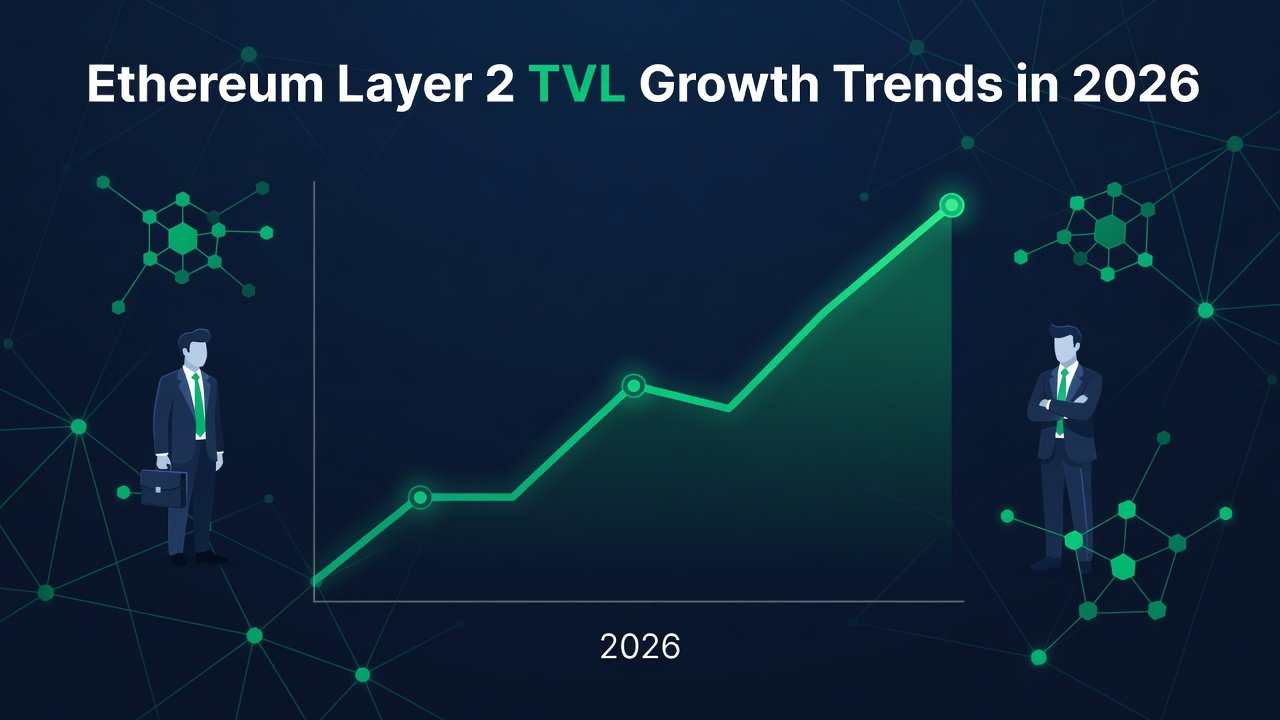
As Ethereum continues its evolution into a more scalable ecosystem, Layer 2 solutions have become central to handling increased demand without compromising security or decentralization. In 2026, analysts and institutional investors rely on fresh data from sources like L2Beat and Dune Analytics to track total value locked (TVL), active addresses, and transaction volumes. This guide provides a data-driven deep dive into these metrics, highlighting trends that matter for institutional investors and analysts seeking sustainable growth signals beyond surface-level overviews. The year 2026 marks a pivotal point where L2 adoption has matured, with institutions moving beyond experimentation into production deployments across multiple chains.
Key Metrics Explained: TVL, Active Addresses, and Transaction Volume
Understanding Ethereum L2 performance starts with three core metrics. TVL represents the total value of assets locked in protocols on each chain, serving as a proxy for capital commitment. Active addresses measure unique wallet interactions, indicating real user engagement rather than speculative activity. Transaction volume tracks daily or weekly activity levels, revealing throughput efficiency and network utilization. Step-by-step metric interpretation begins with pulling data from L2Beat. First, compare TVL changes over 30-day and 90-day windows to identify momentum. Next, cross-reference with Dune Analytics dashboards for address growth correlations and retention patterns. Finally, calculate volume-to-TVL ratios to spot efficient chains versus those with inflated figures from temporary incentives. For example, a chain showing 40% TVL growth but stagnant address counts may signal liquidity farming rather than organic adoption.
2026 TVL Trends Across Major L2s
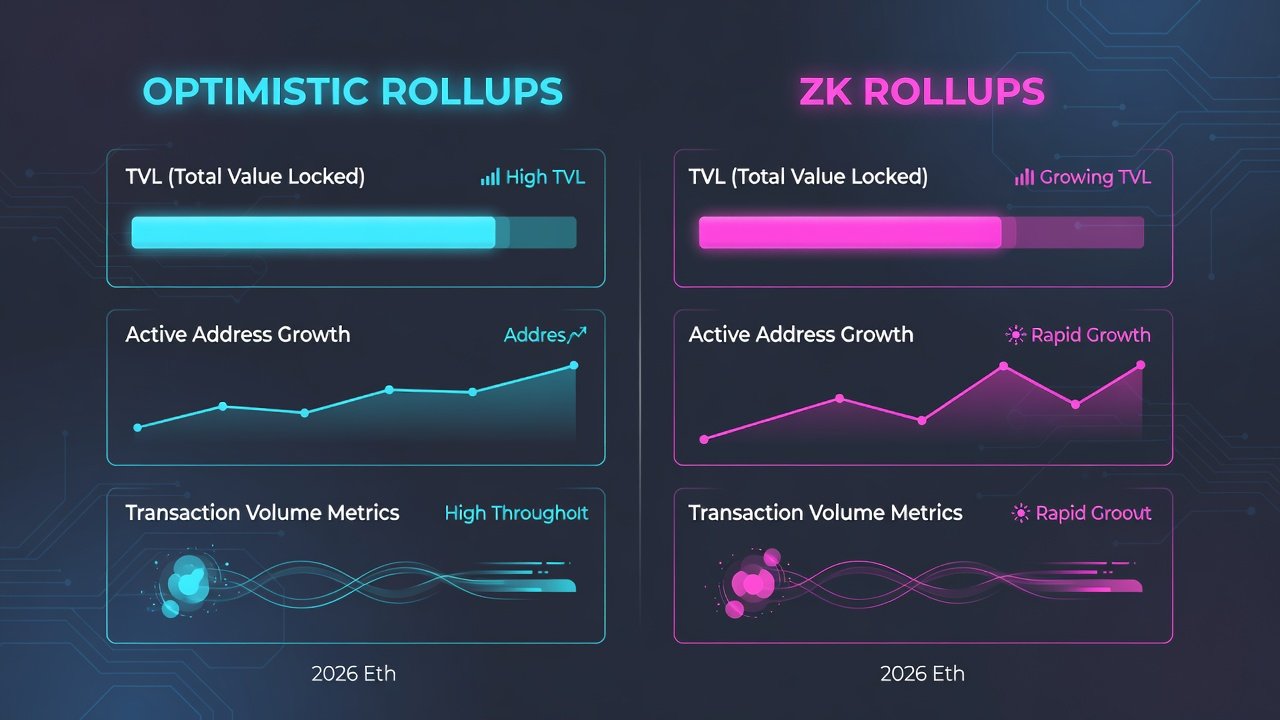
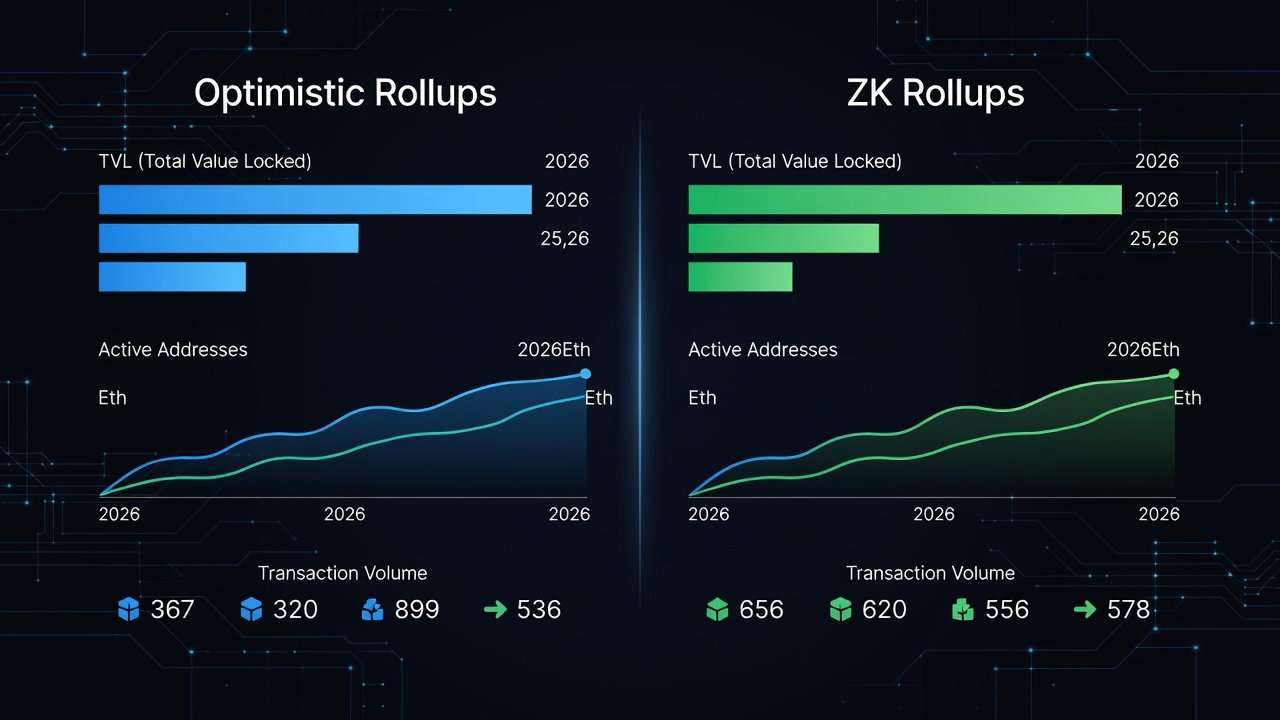
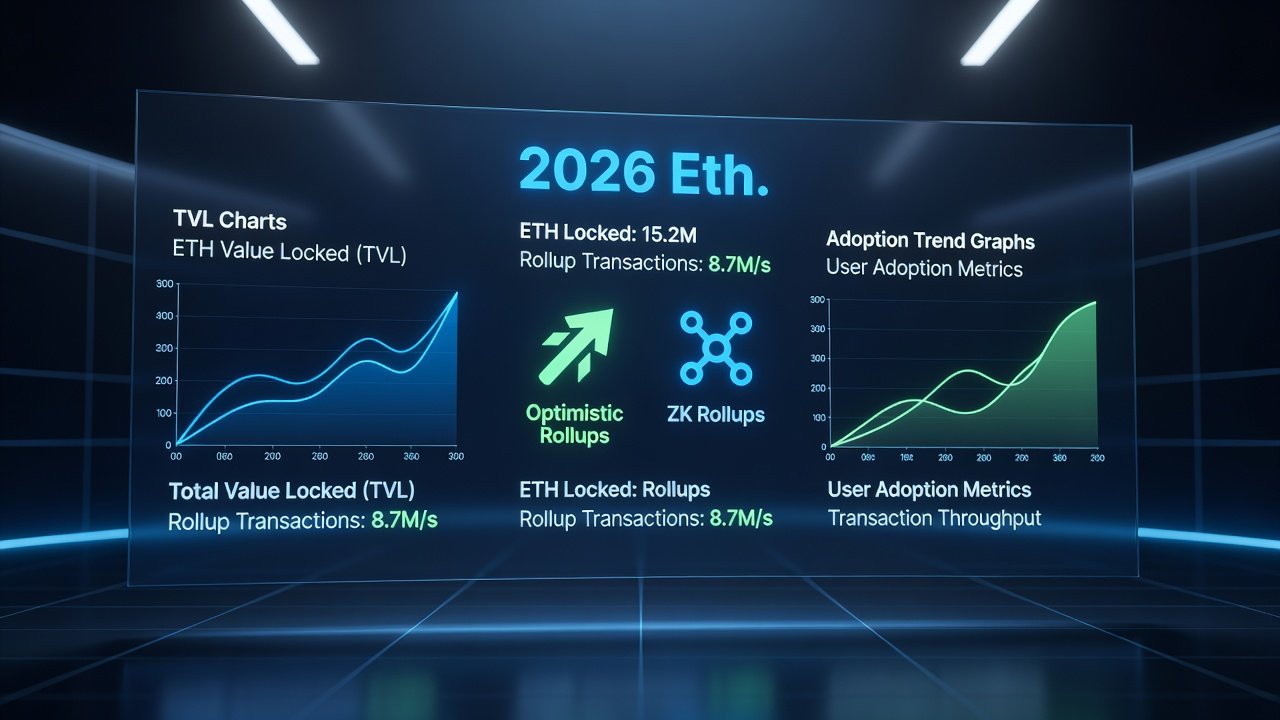
TVL on Ethereum L2s has shown steady maturation in 2026, driven by improved interoperability and institutional-grade tooling. Leading chains demonstrate diversified inflows from both retail DeFi and institutional products such as tokenized treasuries and real-world asset platforms. Data indicates optimistic rollups maintain a slight edge in total locked value due to mature ecosystems and established developer tooling, while ZK rollups accelerate in specific niches like privacy-focused applications and high-throughput gaming. Recent dashboards reveal that overall L2 TVL has benefited from Ethereum's Dencun upgrade effects lingering into 2026, reducing costs and encouraging migration from mainnet.
Optimistic vs ZK Rollups Comparison
Optimistic rollups like Arbitrum and Optimism rely on fraud proofs, offering lower costs for general-purpose DeFi and easier compatibility with existing Ethereum tooling. This makes them attractive for broad retail applications. ZK rollups such as zkSync and Starknet use zero-knowledge proofs for enhanced security, faster finality, and better scalability in compute-intensive scenarios. Institutional examples include TradFi firms integrating ZK solutions for compliant asset tokenization, driving measurable inflows tracked on public dashboards. In 2026, the gap has narrowed as ZK technology matures, with several optimistic chains exploring hybrid approaches to capture both efficiency and security advantages.
Chain-by-Chain Comparisons
Arbitrum continues to lead in TVL with robust active address growth and high transaction volumes concentrated in established DeFi protocols like lending markets and perpetual exchanges. Its ecosystem grants program has sustained developer activity, resulting in consistent user retention. Base has experienced rapid address expansion fueled by consumer-facing apps and social integrations, showing balanced volume metrics that suggest healthy organic growth rather than incentive-driven spikes. zkSync has emerged as a ZK leader with institutional pilots emphasizing scalability and security, particularly in cross-border settlement use cases. Optimism maintains consistent TVL stability supported by its ecosystem grants and focus on public goods funding, which appeals to long-term aligned projects. Additional chains like Polygon zkEVM and Linea show promise in niche segments, with growing transaction volumes tied to enterprise experiments.
Institutional Adoption and TradFi Inflow Trends
Institutional players are increasingly allocating to Ethereum L2s for yield generation, settlement efficiency, and on-chain compliance features. Recent dashboards from Dune Analytics highlight growing wallet clusters tied to traditional finance entities, including asset managers and banks exploring tokenized funds. These trends signal maturing infrastructure ready for larger capital deployments, with examples of L2-based platforms handling institutional-grade custody integrations and regulatory reporting tools. Analysts note that 2026 inflows often favor chains with strong governance frameworks and transparent metric reporting.
Expert Scaling Forecasts for 2026 and Beyond
Analysts project continued TVL expansion as Ethereum upgrades enhance L2 interoperability and reduce fragmentation risks. Forecasts emphasize ZK technology gaining share in high-security use cases such as derivatives and RWA tokenization, while optimistic chains retain dominance in user-facing applications like consumer apps and gaming. Monitoring address quality and retention remains key to distinguishing hype from sustainable signals. Experts recommend combining on-chain data with off-chain partnership announcements for a complete picture of adoption velocity.
Practical Steps for Analyzing L2 Data
Begin by establishing baseline queries on Dune Analytics for historical comparisons. Then layer in L2Beat filters to isolate chains with genuine user growth. Cross-validate findings against Ethereum mainnet activity to understand migration patterns. This methodical approach helps avoid common pitfalls like over-relying on TVL alone.
Common Mistakes to Avoid When Evaluating L2 Metrics
- Ignoring address quality in favor of raw volume numbers, which can mask wash trading.
- Failing to account for incentive programs that temporarily inflate TVL without long-term stickiness.
- Overlooking interoperability developments that could shift flows between chains rapidly.
- Neglecting security audit histories when comparing optimistic and ZK options.
Investor Checklist for Spotting Sustainable Growth
- Verify TVL sources and recent 30-day trends on L2Beat to ensure data accuracy.
- Analyze active address retention rates via Dune queries for genuine engagement signals.
- Compare transaction fees and finality times across optimistic and ZK options to match use-case needs.
- Review institutional partnership announcements for credible inflows and real-world utility.
- Assess ecosystem diversity to avoid over-reliance on single protocols or sectors.
- Monitor governance participation and treasury health as indicators of long-term viability.
- Track developer activity metrics alongside user growth for balanced evaluation.
Frequently Asked Questions
How do I interpret sudden TVL spikes on L2s?
Cross-check with transaction volume and address metrics to confirm organic growth rather than temporary liquidity events or single large deposits.
Which rollup type is better for institutions in 2026?
ZK rollups often suit compliance-heavy use cases due to cryptographic guarantees, while optimistic rollups excel in broad DeFi accessibility and lower operational complexity.
Where can I access the latest L2 data?
Visit Dune Analytics for custom dashboards and L2Beat for standardized TVL rankings and risk assessments.
What role does Ethereum mainnet play alongside L2s?
Mainnet serves as the settlement layer, with L2s handling execution; monitoring bridge volumes helps track overall ecosystem health.
Conclusion
Ethereum L2 metrics in 2026 offer actionable insights for analysts tracking TVL, engagement, and institutional flows. By combining data from authoritative platforms like Ethereum.org resources with structured interpretation frameworks, stakeholders can identify chains positioned for enduring success amid evolving market dynamics.
No comments yet. Be the first!