 CryptoChain Blog
Introduction to 2026 Ethereum L2 Landscape
Ethereum Layer 2 solutions continue to drive scalability and adoption in 2026, with metrics from sources like L2Beat and Dune Analytics revealing clear patterns in total value locked (TVL), user activity, and institutional participation. This analysis examines TVL breakdowns between optimistic and ZK rollups, active address trends, and emerging inflows from traditional finance. As Ethereum scales through its modular roadmap, Layer 2 networks have become the primary venue for decentralized applications, DeFi protocols, and emerging use cases such as on-chain gaming and real-world asset tokenization. Readers seeking to understand where capital and users are concentrating will find concrete data points and forward-looking forecasts that go beyond surface-level summaries.
Understanding TVL in Ethereum L2s
Total value locked serves as a primary indicator of ecosystem health, measuring the aggregate value of assets deposited across bridges, liquidity pools, and smart contracts on each Layer 2. While TVL alone does not capture usage velocity or revenue generation, it provides a standardized benchmark when tracked consistently over time. In 2026, analysts combine TVL figures with on-chain activity metrics to distinguish between speculative inflows and sustainable growth. Data aggregation platforms allow users to filter by rollup type, enabling precise comparisons that reveal whether optimistic or zero-knowledge architectures are attracting more capital.
TVL Breakdown: Optimistic vs ZK Rollups
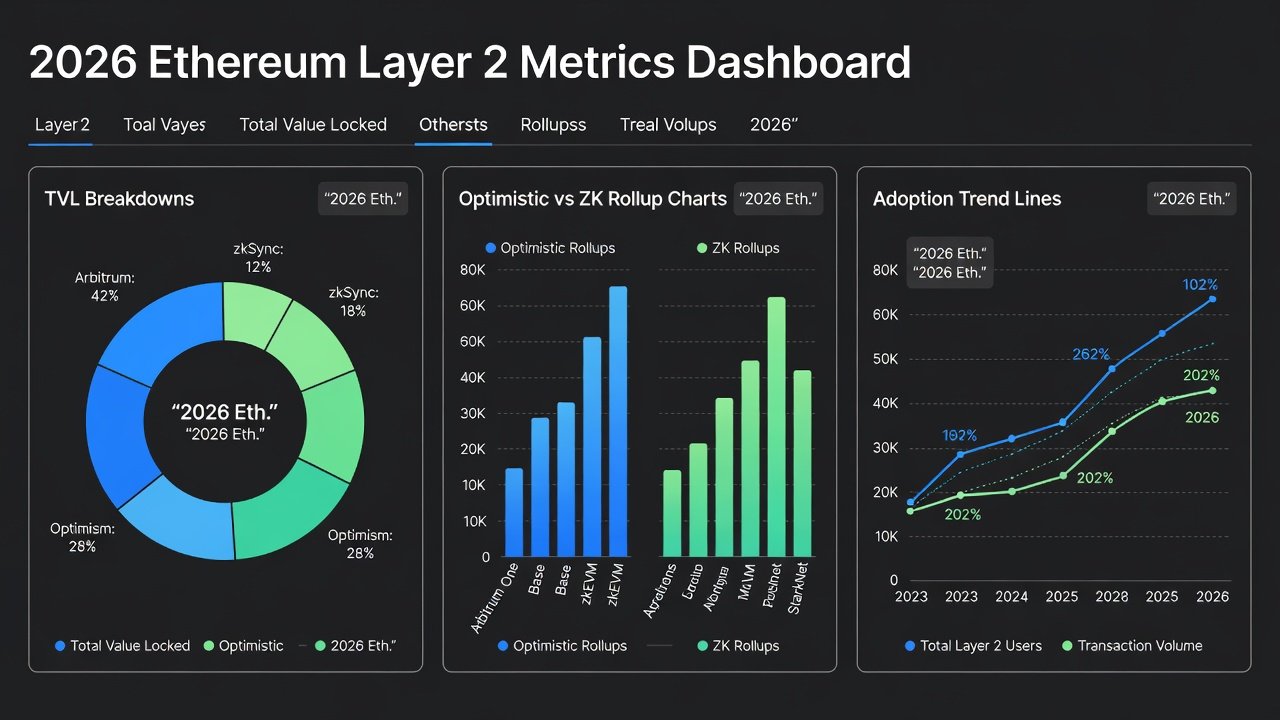
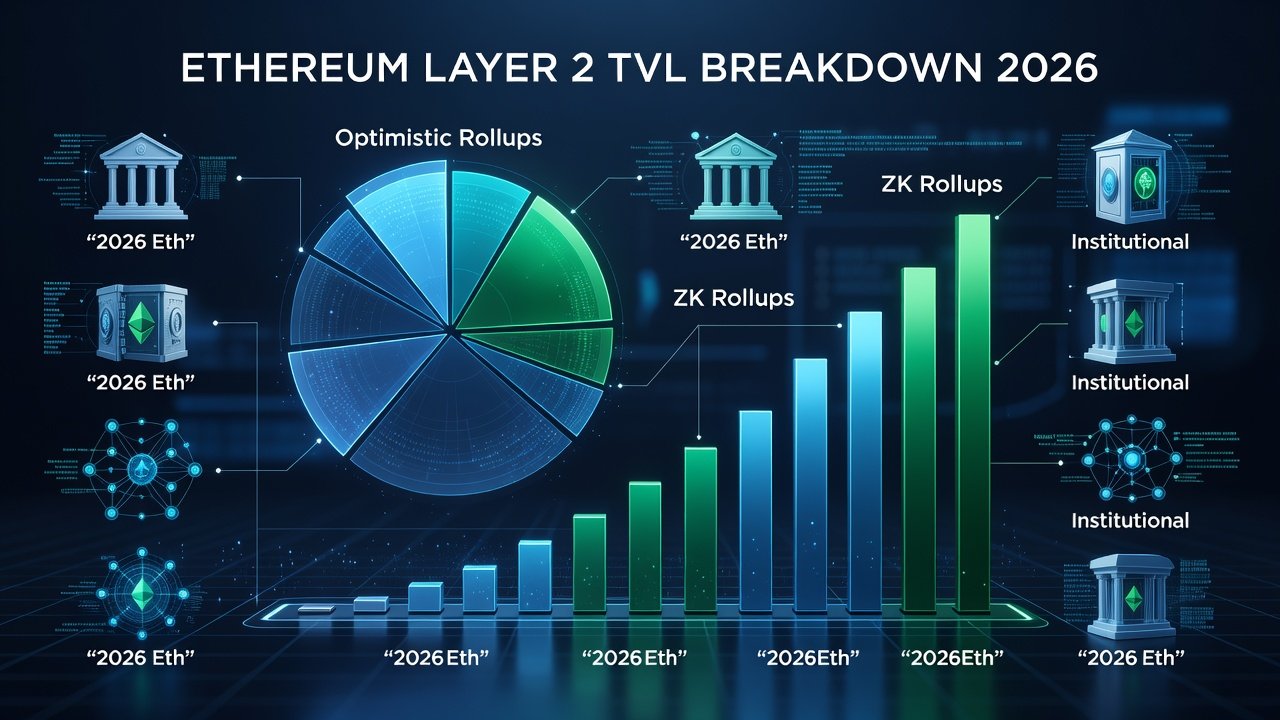
Optimistic rollups maintain a significant share of Ethereum L2 TVL due to their mature ecosystems and EVM compatibility. These solutions rely on fraud proofs and a seven-day challenge period, which has proven reliable for high-volume applications. ZK rollups show faster quarterly growth rates, driven by improved proof generation and lower verification costs. Data from L2Beat highlights how optimistic solutions like Arbitrum and Optimism hold steady positions while ZK projects accelerate. Within the optimistic category, protocols benefit from established developer tooling and grant programs that encourage new application deployment. ZK ecosystems, by contrast, emphasize cryptographic security guarantees that appeal to institutions requiring stronger assurances against invalid state transitions. Quarterly forecasts suggest ZK TVL could narrow the gap with optimistic leaders by the end of 2026 if current proof-efficiency trends persist.
Active Address Growth and User Adoption
Active addresses across leading L2s have expanded steadily, reflecting broader DeFi and gaming usage. Daily and monthly active address counts serve as leading indicators of organic demand, often preceding TVL increases by several weeks. Protocols that optimize user onboarding through account abstraction and social login features typically record the steepest address growth curves. Dune Analytics dashboards track these metrics across multiple chains, allowing observers to correlate address spikes with specific catalyst events such as token launches or liquidity mining campaigns. Quarterly forecasts indicate continued double-digit growth through year-end 2026, supported by improved onboarding tools and gas fee optimizations that lower barriers for retail participants.
TradFi Inflows and Protocol Examples
Institutional capital flows into protocols such as Base and zkSync illustrate rising TradFi interest. These inflows correlate with enhanced compliance features and integration with traditional payment rails. For example, Base has attracted custody solutions from established financial entities seeking exposure to decentralized finance without managing private keys directly. zkSync has partnered with infrastructure providers to enable compliant stablecoin issuance on its ZK stack. Monitoring these inflows requires cross-referencing on-chain bridge volumes with off-chain announcements, a process simplified by public dashboards that tag large wallet movements.
Side-by-Side L2 Comparisons
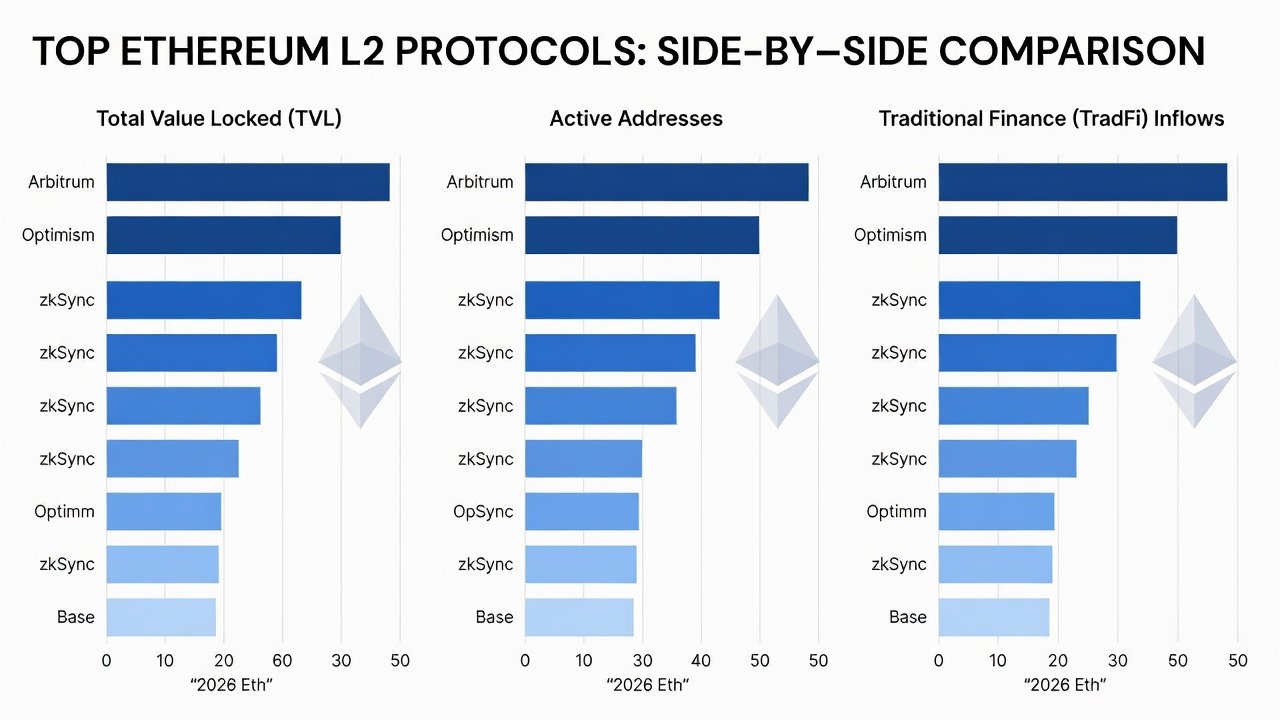
Comparative analysis helps investors and developers identify relative strengths. Key dimensions include TVL concentration, active address velocity, developer activity measured by GitHub commits, and bridge inflow rates. Arbitrum leads in total TVL among optimistic rollups with strong developer activity across lending and perpetual futures protocols. Optimism distinguishes itself through public goods funding mechanisms that recycle sequencer revenue into ecosystem grants. zkSync demonstrates leading ZK adoption with rapid TVL increases tied to its Elastic Chain vision. Base benefits from strong TradFi partnerships driving address metrics and consistent daily transaction counts. Visual chart interpretations from Dune Analytics dashboards show TVL trajectories diverging by rollup category, with ZK solutions displaying steeper slopes in recent quarters.
Emerging Trends: Restaking Impacts
Restaking mechanisms introduce new yield opportunities on L2s, influencing TVL distribution and security models. By allowing assets to secure multiple protocols simultaneously, restaking can amplify returns but also introduces correlated risk across ecosystems. Developers should monitor how restaked assets affect bridge security and liquidity pools, particularly during periods of market stress. Several L2s have begun integrating restaking primitives directly into their governance frameworks, creating feedback loops where staking rewards influence application deployment incentives.
Quarterly Growth Forecasts
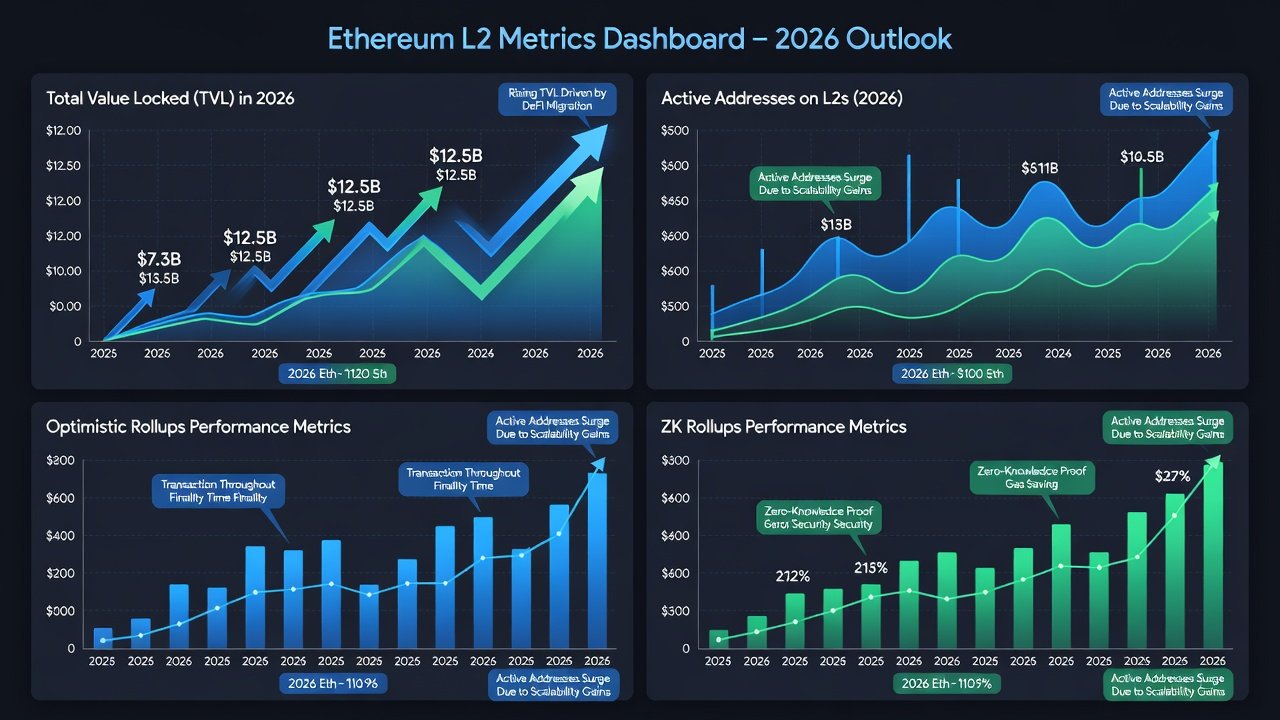
Forward-looking models built on historical Dune Analytics data project continued expansion in both TVL and active addresses. Conservative scenarios assume steady sequencer revenue and moderate institutional adoption, while optimistic scenarios incorporate accelerated ZK proof advancements and broader real-world asset integration. These forecasts serve as planning baselines rather than guarantees, and users are encouraged to update assumptions quarterly as new data becomes available.
Actionable Takeaways for Developers and Investors
Developers can prioritize ZK-compatible tooling for future-proofing and experiment with account abstraction to accelerate address growth. Investors should track active address velocity alongside TVL to assess sustainable growth rather than relying on TVL snapshots alone. Review quarterly forecasts on Dune Analytics for timely portfolio adjustments and diversify across both optimistic and ZK rollups to capture different risk-return profiles. Practical steps include setting up automated alerts for bridge inflow thresholds and maintaining exposure limits relative to overall portfolio volatility.
Mistakes to Avoid When Analyzing L2 Metrics
- Over-reliance on TVL without context of token unlocks or liquidity concentration.
- Ignoring the difference between bridged TVL and native asset issuance on each L2.
- Failing to account for sequencer centralization risks when evaluating long-term sustainability.
- Neglecting to cross-reference multiple data sources, which can lead to incomplete pictures of adoption.
FAQ: Interpreting Metrics for Portfolio Decisions
How do I compare TVL across rollups? Normalize figures using L2Beat data and factor in token unlocks or liquidity concentration risks before drawing conclusions.
What signals healthy adoption? Consistent active address growth combined with rising transaction counts and stable or increasing average transaction values.
Should restaking influence allocation? Yes, but evaluate associated smart contract risks and diversification across multiple restaking platforms first.
How frequently should metrics be reviewed? Weekly monitoring of key dashboards combined with deeper quarterly reviews provides an effective balance between responsiveness and noise reduction.
Conclusion
2026 Ethereum L2 metrics underscore a maturing ecosystem where data-driven decisions separate sustainable projects from hype. Continuous monitoring via authoritative dashboards such as ethereum.org resources and L2Beat remains essential for all participants seeking to navigate the evolving landscape effectively.
No comments yet. Be the first!