 CryptoChain Blog
Introduction to Ethereum L2 Metrics in 2026
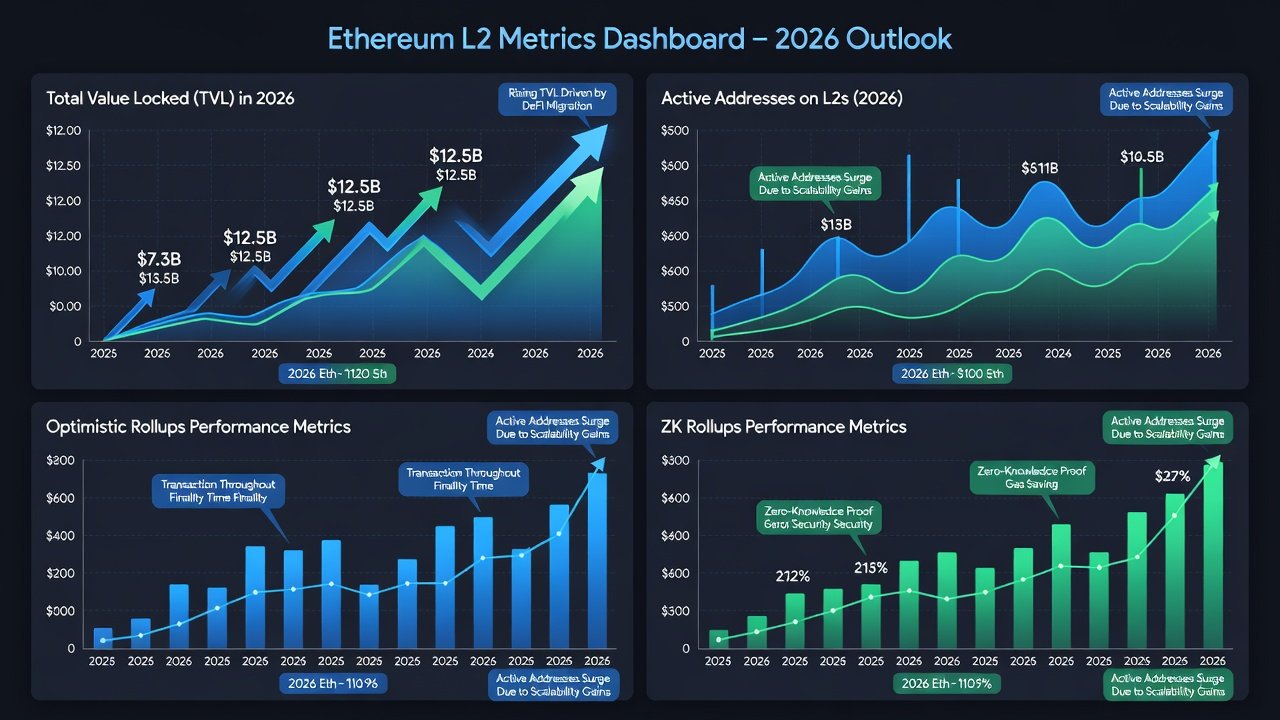
As Ethereum continues its evolution in 2026, Layer 2 solutions remain central to scaling the network while maintaining security and decentralization. Metrics such as Total Value Locked (TVL), active addresses, transaction volumes, and rollup-specific comparisons provide critical insights into ecosystem health and adoption trends. Investors, developers, and analysts who master these data points can identify opportunities in DeFi, NFTs, and institutional applications. This comprehensive guide walks through practical methods for interpreting 2026 Ethereum L2 data to support better decision-making.
The focus remains on sustainable growth signals rather than hype-driven spikes. By combining quantitative dashboards with qualitative context like protocol upgrades and partnerships, users gain a fuller picture of where value is accruing across optimistic and zero-knowledge rollups.
Getting Started with L2Beat for TVL Analysis
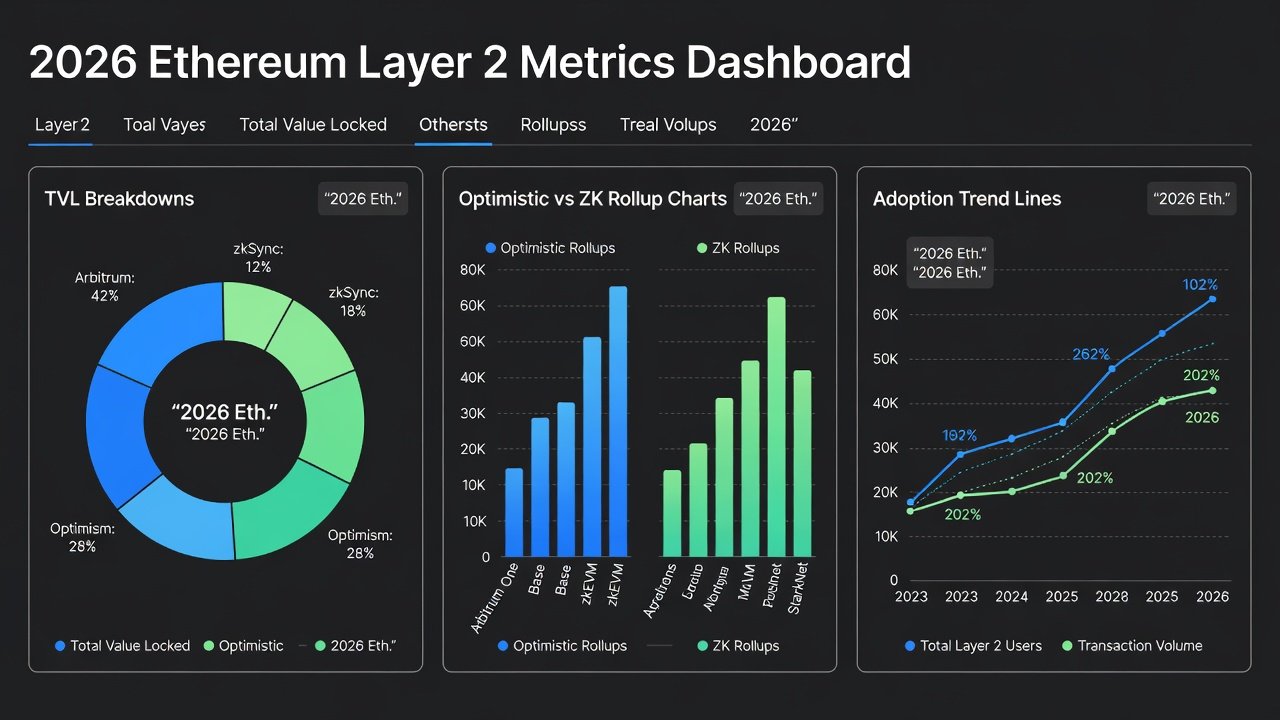
L2Beat stands as the go-to resource for Ethereum L2 TVL breakdowns. Users should begin by navigating to the main dashboard and sorting projects by current TVL to identify leaders. Apply filters for optimistic rollups versus ZK rollups to isolate performance differences in 2026. Drill down into individual project pages to review token allocations, bridge inflows, and category-specific TVL such as decentralized exchanges or lending protocols.
Practical steps include exporting CSV data for custom analysis and setting up alerts for TVL milestones. Compare 7-day, 30-day, and 90-day changes to distinguish short-term volatility from longer-term adoption curves. For instance, examine how bridged assets contribute to headline TVL versus native activity within the ecosystem.
Advanced users can cross-reference L2Beat data with on-chain explorers to verify liquidity depth and detect potential wash trading or inflated figures.
Using Dune Analytics for Active Addresses and On-Chain Data
Dune Analytics empowers users to query raw blockchain data across Ethereum L2 networks. Start with community dashboards focused on daily active addresses and unique wallet interactions. Build custom queries that filter transactions by smart contract addresses to measure genuine user engagement rather than bot activity.
Combine address metrics with gas usage and transaction count trends to understand usage intensity. In 2026, track cohort retention by analyzing repeat address activity over multiple weeks. Export results into visualization tools for presentations or investment reports.
Examples include querying Base network addresses versus Arbitrum to reveal retail app adoption patterns. Users can also monitor stablecoin transfer volumes as a proxy for institutional flows and payment utility.
Optimistic vs ZK Rollup Comparisons
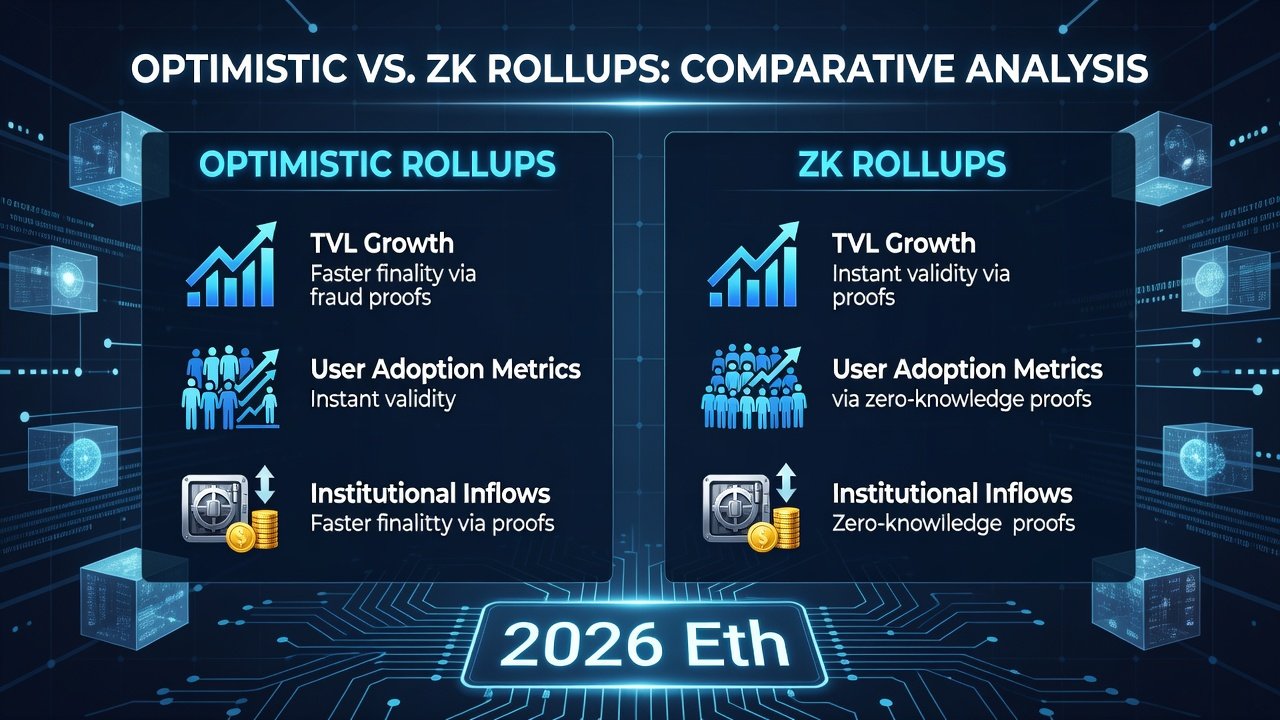
Optimistic rollups such as Arbitrum and Optimism prioritize EVM compatibility, enabling seamless deployment of existing Ethereum applications. They rely on fraud proofs and challenge periods, which can introduce slight delays in finality. ZK rollups including zkSync, Starknet, and Polygon zkEVM leverage validity proofs for immediate finality and enhanced security guarantees.
In 2026, compare these models by examining TVL share, active address distribution, and developer activity. Optimistic chains often dominate DeFi TVL due to mature liquidity pools, while ZK solutions attract projects requiring high-throughput privacy features or gaming applications.
- Review proof generation costs and verification times on each rollup type.
- Assess ecosystem grants, hackathon participation, and GitHub commit frequency.
- Track cross-rollup bridge volumes to understand liquidity migration patterns.
- Evaluate user experience factors such as withdrawal times and wallet support.
These comparisons help determine which infrastructure best supports specific use cases like institutional tokenization or consumer-facing applications.
Institutional Adoption Signals and TradFi Inflows
Institutional participation in 2026 appears through custody solutions, tokenized real-world assets, and enterprise-grade bridges. Monitor large wallet accumulations and stablecoin minting events on L2 networks. Partnership announcements from banks or asset managers often precede measurable on-chain inflows.
Cross-reference public filings with dashboard data to validate claims of adoption. Resources such as ethereum.org detail ongoing scaling improvements that reduce barriers for traditional finance integration.
Real Examples from Top L2s in 2026
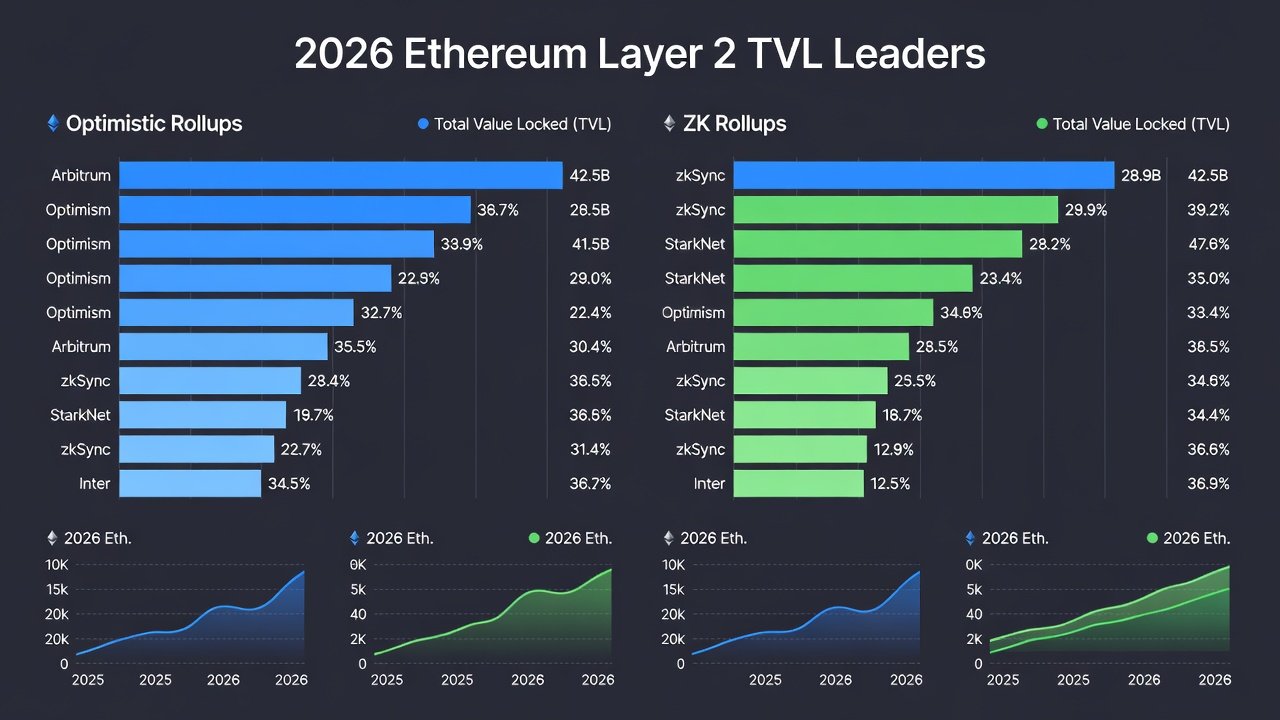
Arbitrum frequently leads TVL rankings thanks to established decentralized exchanges and lending markets. Its active address growth reflects both retail DeFi users and emerging institutional pilots. Base has captured significant consumer attention through social and gaming applications, showing rapid address increases despite lower average TVL per user.
Optimism continues to emphasize public goods funding and governance experiments that correlate with steady retention metrics. ZK-focused chains like zkSync demonstrate faster finality advantages in high-frequency trading scenarios. Polygon zkEVM attracts enterprise experiments due to its compatibility layer and corporate backing.
Analyzing these examples side-by-side reveals distinct adoption vectors: some L2s excel in liquidity depth while others prioritize user onboarding velocity.
Tips for Spotting Emerging Trends
Identify sustainable trends by requiring concurrent growth in TVL, daily active addresses, and protocol revenue. Set threshold alerts on major dashboards for multi-week accelerations. Watch new protocol launches and grant programs that historically precede metric improvements.
Seasonal patterns around major conferences or network upgrades can provide context for temporary spikes. Always validate dashboard data against multiple sources before acting on apparent trends.
Common Pitfalls to Avoid
Headline TVL numbers can be misleading when they include bridged assets with minimal on-chain usage. Short-term address surges often stem from airdrop farming rather than organic adoption. Overlooking differences in rollup security models leads to inaccurate risk assessments. Relying on single-metric views without cross-checking transaction quality produces incomplete conclusions.
FAQ: Turning Metrics into Decisions
How do I decide between investing in an L2 token? Prioritize projects showing consistent 90-day growth in both TVL and retained addresses alongside transparent tokenomics and active development.
What signals a strong developer ecosystem? Rising GitHub activity combined with increasing unique contract deployments and address engagement on Dune Analytics dashboards.
Can metrics predict regulatory impacts? Monitor ZK rollup adoption curves and compliance-focused features such as privacy-preserving proofs that may align with future regulatory expectations.
How should developers choose an L2 for deployment? Evaluate EVM compatibility, withdrawal times, and current TVL concentration in their target category using L2Beat filters.
What role do active addresses play in valuation models? They serve as a leading indicator of network effects when paired with revenue data and user retention statistics.
Additional authoritative references are available at L2Beat and Dune Analytics.
Conclusion
Proficiency in analyzing 2026 Ethereum L2 metrics transforms raw data into strategic advantages for investment allocation and protocol development. Regular monitoring of TVL breakdowns, address trends, and optimistic versus ZK distinctions equips participants to navigate the maturing Layer 2 landscape with greater confidence and precision.
No comments yet. Be the first!