 CryptoChain Blog
Introduction to Ethereum L2 Evolution in 2026
Ethereum Layer 2 solutions have matured significantly by 2026, scaling the base layer while attracting both retail users and institutional capital. This analysis examines total value locked trends, active address growth, and transaction volume shifts across major rollups. Data sources such as L2Beat and Dune Analytics provide transparent on-chain visibility into these metrics. The ecosystem now includes dozens of active rollups, each competing on security, cost, and developer tooling. As Ethereum completes further upgrades to its data availability layer, L2s benefit from cheaper batch posting and improved interoperability. This creates a fertile environment for decentralized finance protocols, gaming platforms, and emerging real-world asset tokenization initiatives. Readers seeking long-term opportunities must move beyond headline TVL numbers and examine the underlying drivers of growth, including user retention and capital efficiency. The following sections break down the key indicators with practical examples drawn from current network behaviors.
TVL Breakdown Across Major Rollups
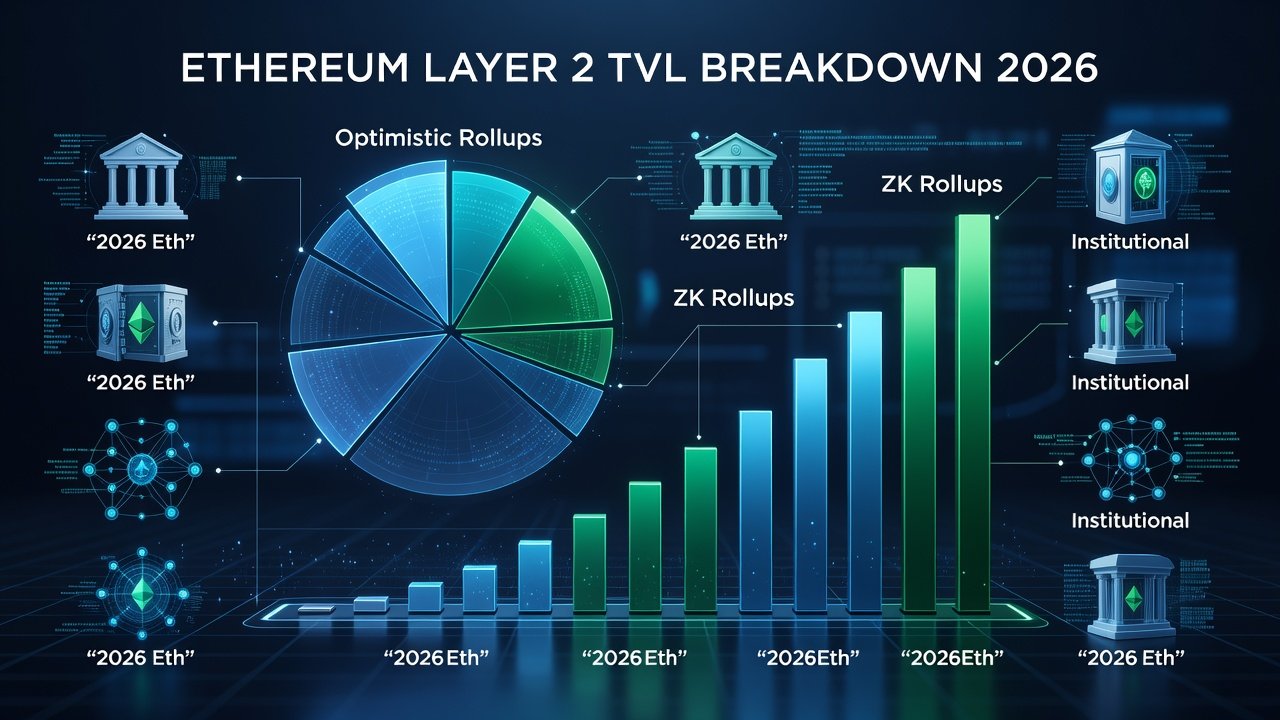
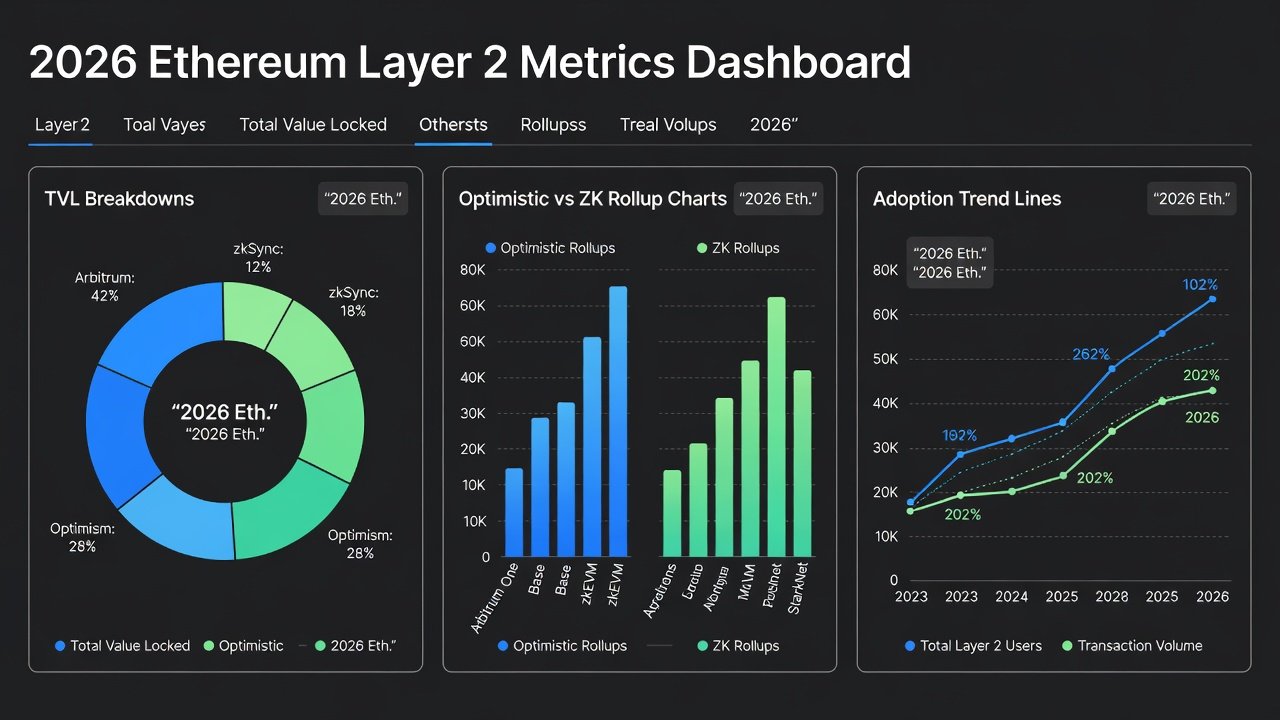
Total value locked remains a core health indicator for L2 networks. While absolute figures fluctuate with market conditions, relative market share reveals which ecosystems are capturing the most capital. Optimistic rollups like Arbitrum and Optimism maintain strong positions due to mature ecosystems and extensive protocol integrations, whereas ZK-based solutions such as zkSync and Starknet demonstrate faster growth in specific DeFi verticals like derivatives trading and privacy-preserving applications. Additional networks including Base, Linea, and Polygon zkEVM have carved out niches by focusing on consumer-facing applications and lower entry barriers for new developers. TVL concentration often occurs in lending markets and liquidity pools that offer competitive yields, yet diversified ecosystems show more resilience during market drawdowns. Analysts frequently compare TVL velocity, which measures how efficiently locked capital generates on-chain activity, to identify networks where growth is sustainable rather than driven by temporary incentives. Cross-chain bridges also influence these figures, as capital migrates between L2s in search of better opportunities or lower fees.
Optimistic vs ZK Solutions: Data-Driven Comparison
Optimistic rollups rely on fraud proofs and offer strong compatibility with existing Ethereum tooling, making them attractive for teams porting complex smart contracts. ZK rollups use validity proofs for immediate finality and enhanced security guarantees, reducing the need for challenge periods during withdrawals. Recent trends from on-chain dashboards indicate ZK networks are closing the gap in user activity, particularly in areas like perpetual futures and automated market makers where fast settlement provides a competitive edge. Examples include zkSync Era hosting high-volume DEXes that benefit from instant proof verification, while Arbitrum continues to dominate in general-purpose DeFi lending due to its established liquidity depth. Trade-offs remain evident: optimistic chains typically feature lower proof-generation overhead but longer withdrawal times, whereas ZK implementations require more computational resources upfront yet deliver superior scalability for complex computations. Developers evaluating deployment options often test both environments for gas efficiency and tooling maturity before committing resources.
Active Addresses, Transaction Volume, and User Adoption
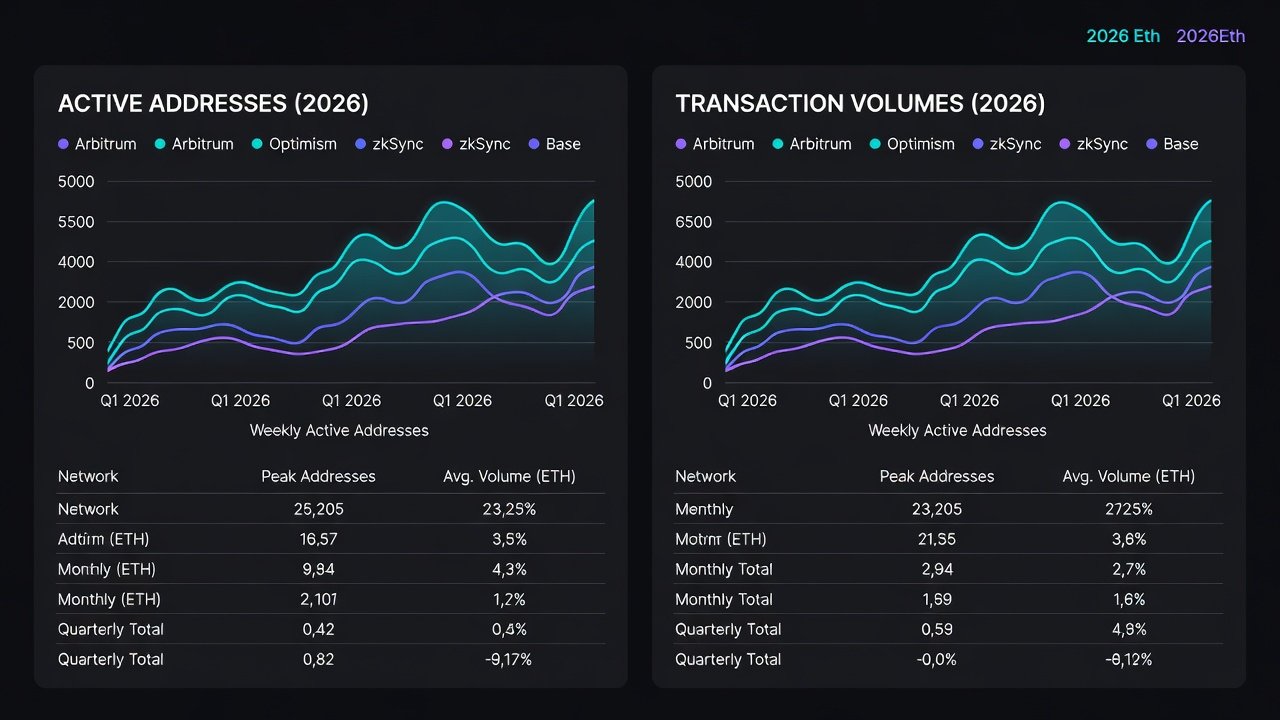
Growth in daily active addresses signals genuine usage beyond speculative activity. Transaction volume shifts highlight which networks handle the highest throughput for payments, swaps, and lending. TradFi integrations, including bank-backed stablecoins and institutional custody solutions, contribute to steady inflows on select L2s by providing compliant on-ramps that appeal to larger players. For instance, networks seeing consistent address growth above 20 percent month-over-month often correlate with new protocol launches or incentive programs that retain users after initial airdrop farming ends. Transaction volume analysis should distinguish between simple transfers and complex contract interactions, as the latter better reflect productive DeFi usage. Practical monitoring involves setting up custom queries that filter for unique addresses interacting with at least three distinct protocols within a seven-day window, providing a clearer picture of engaged participants rather than one-time visitors.
TradFi Inflows and Institutional Influence
Institutional adoption manifests through partnerships with asset managers and regulated entities launching products on Ethereum L2s. These integrations drive TVL stability and introduce new liquidity pools that benefit retail traders through tighter spreads. Monitoring wallet clustering and large transfer patterns on Dune helps distinguish organic growth from temporary capital rotation. Real-world examples include tokenized treasury products and compliant stablecoin issuers selecting specific L2s for their settlement layers. The presence of such players often leads to enhanced security audits and more predictable fee markets, yet it can also introduce governance tensions if institutional preferences diverge from community priorities. Participants should evaluate custody risks and regulatory compliance when engaging with institutionally backed protocols, particularly around KYC requirements that may affect anonymous trading strategies.
Practical Steps to Monitor L2 Metrics
- Visit L2Beat for standardized TVL rankings and technology breakdowns updated daily from on-chain sources.
- Query Dune Analytics dashboards for custom transaction and address metrics, saving queries for repeated use.
- Cross-reference with DeFiLlama for protocol-level TVL attribution and yield comparisons across chains.
- Review official Ethereum documentation at ethereum.org for roadmap context on data availability upgrades affecting L2 costs.
- Set alerts for significant changes in active addresses or bridge inflows using notification tools tied to public APIs.
- Analyze weekly governance forums of individual rollups to anticipate upcoming feature releases that could shift user behavior.
Checklist for Evaluating L2 Network Health
- TVL diversification across multiple protocols rather than concentration in one dominant application.
- Steady or growing active address counts over 30-day periods, validated against multiple data providers.
- Balanced mix of optimistic and ZK solutions in portfolio exposure to hedge against technology-specific risks.
- Evidence of TradFi partnerships without excessive centralization that could impact censorship resistance.
- Transparent governance and active developer community measured by GitHub commits and forum participation.
- Low bridge dependency risk through diversified liquidity sources and audited withdrawal mechanisms.
Interpreting Rising TVL for DeFi Opportunities
Increasing TVL often indicates capital confidence but requires context to avoid misinterpretation. Sustainable growth pairs TVL expansion with usage metrics and revenue generation for the network itself. Readers should avoid chasing isolated TVL spikes and instead assess underlying activity, such as whether new capital flows into productive lending or remains in low-velocity stablecoin holdings. Concrete examples include networks where TVL growth coincides with rising options trading volume, signaling real demand for derivatives infrastructure. Risk factors to consider encompass smart contract vulnerabilities in newer protocols and potential liquidity fragmentation across competing L2s. Successful investors typically combine these indicators with off-chain sentiment analysis from developer communities to time entries into emerging opportunities.
Common Mistakes to Avoid When Analyzing L2 Data
One frequent error is relying solely on aggregate TVL without examining the distribution of that value across protocols. Another involves ignoring the impact of incentive programs that temporarily inflate metrics before fading. Users sometimes overlook withdrawal delays when comparing optimistic and ZK chains, leading to unexpected liquidity constraints during volatile periods. Cross-referencing multiple analytics platforms helps mitigate data discrepancies caused by differing methodologies in counting bridged assets.
FAQs on Data Reliability
How reliable are L2Beat TVL figures? L2Beat aggregates on-chain data with standardized methodologies, though users should verify bridge balances independently for high-stakes decisions.
Can Dune queries be trusted for real-time decisions? Dune provides community-built dashboards; always review the underlying SQL and recent updates for accuracy before acting on trends.
What does TradFi adoption mean for retail users? It typically brings deeper liquidity and new products but may introduce compliance layers affecting certain anonymous strategies.
How often should metrics be checked? Weekly reviews suffice for most participants, with daily checks during periods of high market volatility or major protocol upgrades.
Conclusion
Ethereum L2 metrics in 2026 reflect a maturing landscape where data transparency empowers informed participation. By combining TVL analysis with address and volume trends, and factoring in TradFi developments, users can better navigate DeFi opportunities while managing risks effectively. Continuous monitoring using the tools and checklists outlined above supports more resilient investment approaches as the ecosystem evolves.
No comments yet. Be the first!