 CryptoChain Blog
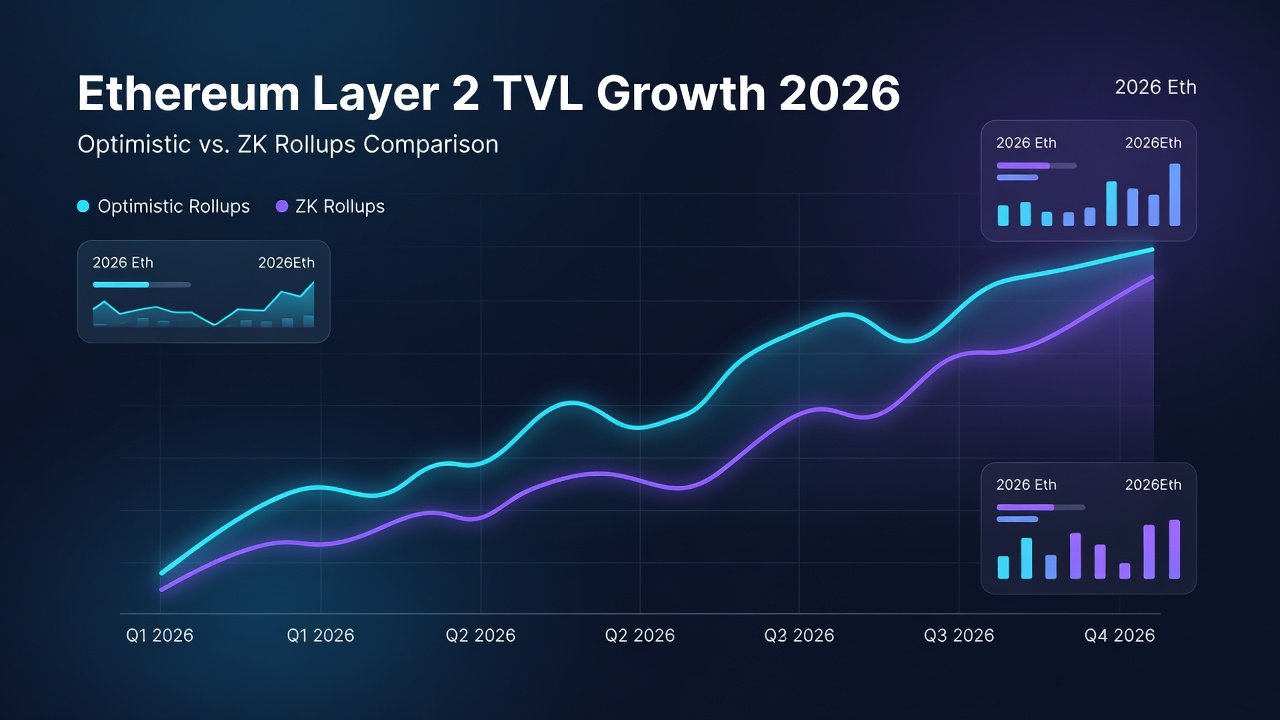
Introduction to Ethereum L2 TVL in 2026
Ethereum Layer 2 solutions continue to dominate scaling discussions as total value locked metrics reveal shifting adoption patterns throughout 2026. This analysis draws from established dashboards such as L2Beat and Dune Analytics to break down performance across optimistic and zero-knowledge rollups. It highlights institutional signals, user behavior trends, and competitive dynamics that have emerged in the latter half of the year. Readers seeking actionable intelligence will find detailed comparisons, practical interpretation guidance, and forward-looking scenarios that go beyond surface-level summaries.
Rollup-Type Breakdown: Optimistic vs ZK Solutions
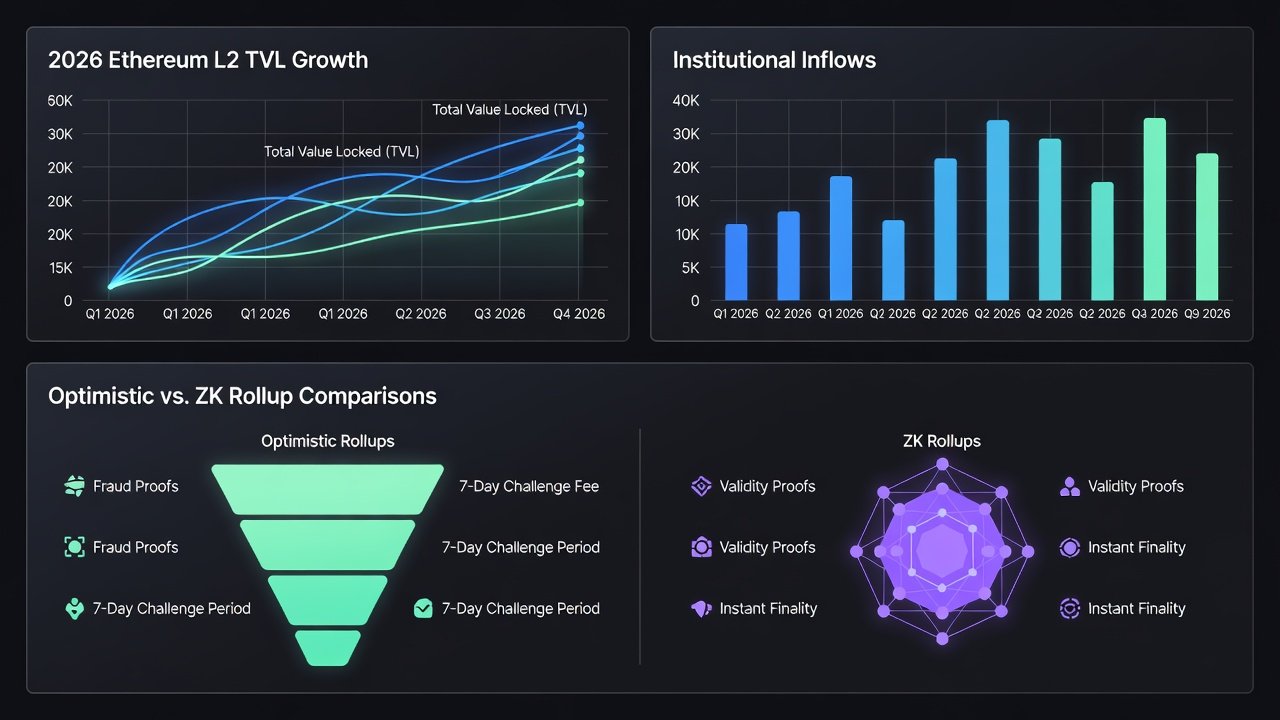
Optimistic rollups maintain strong positions in TVL due to mature ecosystems and developer familiarity built over multiple years. These platforms benefit from seamless compatibility with existing Ethereum tooling, allowing rapid deployment of DeFi applications and NFT marketplaces. In contrast, ZK solutions show accelerated growth in transaction efficiency, particularly where privacy and rapid finality matter most for institutional and high-frequency use cases. Key metrics include active addresses and daily transaction volumes, with ZK platforms often leading in cost-sensitive applications such as payments and gaming. The divergence becomes clear when examining growth curves: optimistic chains tend to attract broader retail participation while ZK variants capture concentrated activity from sophisticated users.
Key Metrics Comparison
- Active addresses: Optimistic rollups lead in broad retail engagement while ZK variants capture higher per-user activity levels and repeat interactions.
- Transaction volumes: ZK approaches demonstrate superior throughput in high-frequency trading scenarios and complex smart contract executions.
- TVL concentration: Top optimistic chains account for significant portions of overall L2 value, yet ZK ecosystems are closing the gap through targeted liquidity incentives and bridge improvements.
- User retention patterns: Data indicates ZK solutions often achieve higher stickiness once users experience lower fees and faster confirmations.
User Growth Patterns and Institutional Inflows
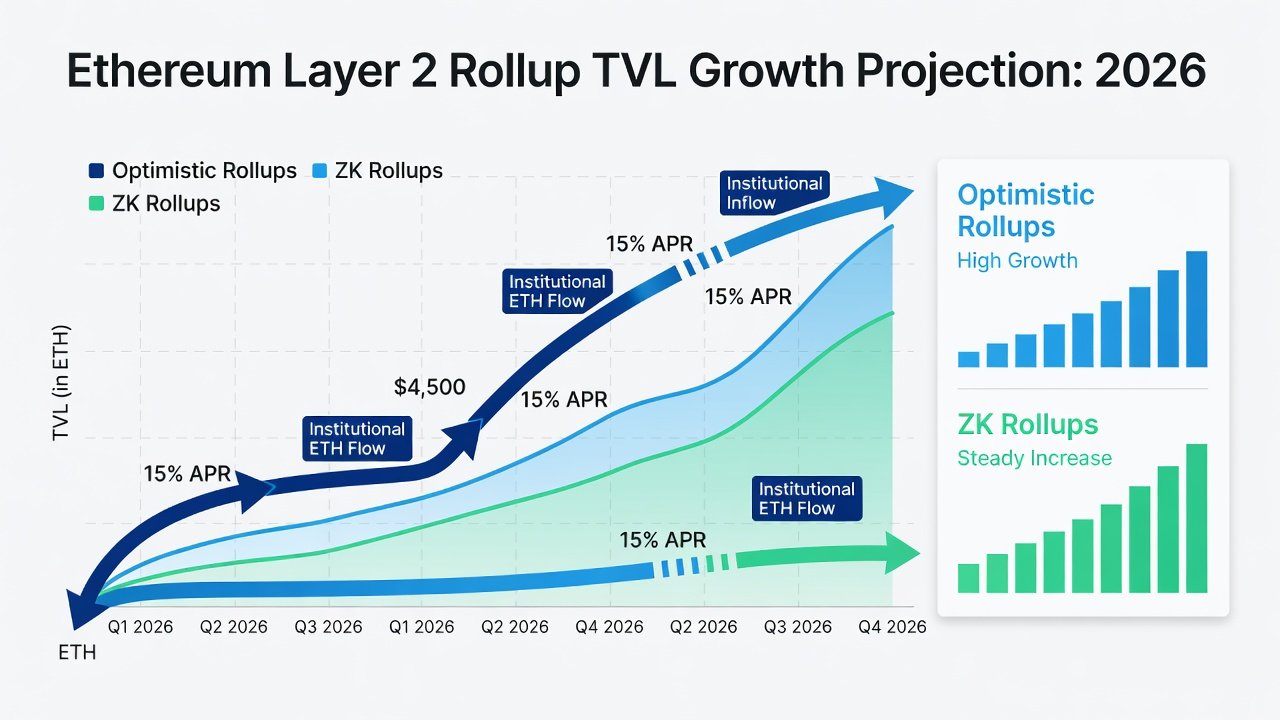
User growth across Ethereum L2s in 2026 reflects both organic expansion and strategic inflows from traditional finance entities. Institutional participation appears through large wallet clustering, protocol-level partnerships, and stablecoin bridges that facilitate compliant on-ramps. These inflows correlate with improved compliance tooling and custody solutions integrated directly into leading rollups. Real-world examples include major DeFi protocols expanding to multiple L2s for liquidity fragmentation reduction, such as those tracked on L2Beat. Additionally, several gaming and social applications have migrated substantial user bases to ZK rollups, resulting in measurable upticks in daily active addresses that outpace earlier optimistic-only deployments.
Interpreting Dashboard Charts from L2Beat and Dune Analytics
Effective analysis starts with normalizing TVL against Ethereum mainnet equivalents and monitoring 30-day moving averages for inflows. Users should cross-reference active address spikes with transaction fee data to distinguish organic growth from temporary incentives. Charts on these platforms typically display stacked area graphs for TVL by chain, line charts for address growth, and bar visualizations for transaction throughput. Practical steps include filtering for verified contracts only, comparing week-over-week changes rather than daily noise, and overlaying external events such as token unlocks or protocol upgrades. This approach helps surface genuine adoption signals amid market volatility.
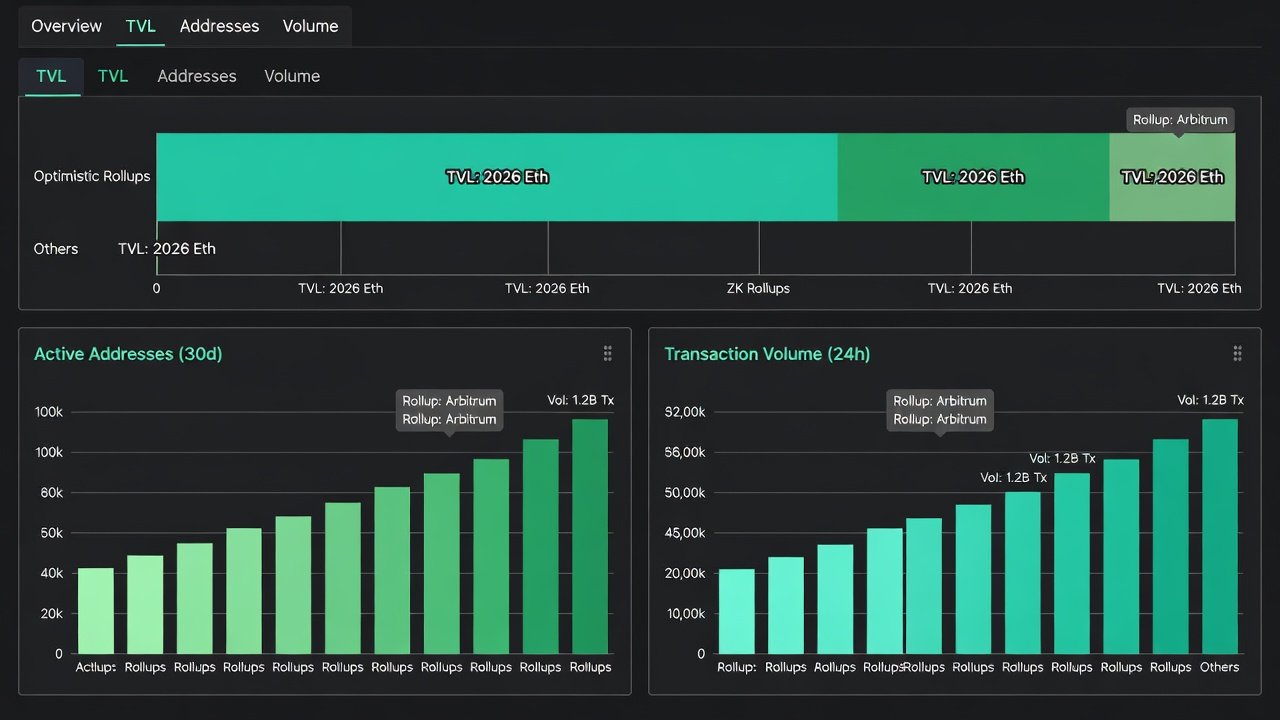
Spotting Emerging Leaders
Watch for consistent month-over-month TVL gains paired with rising unique addresses and sustained transaction counts. Newer ZK projects often exhibit hockey-stick patterns once audit completions and bridge liquidity improve. Examples from top rollups show that chains introducing native account abstraction features have seen rapid address growth, while optimistic platforms with strong sequencer decentralization attract more institutional-grade liquidity pools. Analysts should also track developer activity metrics available on Dune Analytics to identify projects with long-term staying power.
Forecasting Next-Quarter Shifts
Based on current trajectory patterns, expect continued ZK market share expansion in the payments and enterprise sectors while optimistic rollups retain dominance in general-purpose DeFi. Monitor governance proposals around shared sequencing for potential TVL redistribution effects. Scenario planning involves three primary paths: accelerated ZK adoption if hardware acceleration lowers proving costs further; steady optimistic growth if Ethereum mainnet upgrades enhance data availability; or hybrid models where both types coexist through unified liquidity layers. Practical forecasting also requires watching bridge volumes and cross-rollup activity, which often precede larger TVL movements.
Practical Steps for Competitive Intelligence
To extract decision-useful insights, begin by establishing baseline comparisons across at least five leading rollups using standardized time windows. Next, segment data by use case—such as DeFi versus gaming—to avoid misleading aggregates. Then, incorporate qualitative signals like partnership announcements and governance participation rates. Finally, validate dashboard findings against raw on-chain queries on Dune Analytics for accuracy. This multi-layered process reduces the risk of overreacting to short-term fluctuations.
Common Metric Pitfalls: Expanded FAQ
What causes TVL to appear inflated?
Double-counting of bridged assets and yield farming loops can distort raw figures. Always verify against on-chain data sources like Dune Analytics and cross-check with DeFiLlama for independent perspectives.
How reliable are active address counts?
Sybil activity and exchange hot wallets frequently skew numbers; focus on unique interacting addresses with meaningful transaction values above a minimum threshold.
Should users prioritize TVL over transaction volume?
Both metrics matter; high TVL with low activity may indicate locked but idle capital, whereas volume spikes without TVL growth suggest speculative trading rather than sustained utility.
What role do institutional inflows play in metric interpretation?
Large single-entity deposits can temporarily boost TVL without corresponding user growth; examine wallet distribution and holding periods to assess durability.
How do upgrades affect long-term forecasts?
Protocol upgrades that improve scalability or reduce costs often trigger measurable shifts in both TVL and address metrics within weeks, making historical trend analysis essential for accurate projections.
Conclusion
2026 Ethereum L2 TVL data underscores a maturing landscape where both optimistic and ZK technologies carve distinct niches amid evolving user and institutional demands. Stakeholders tracking institutional signals, user metrics, and dashboard nuances will be best positioned to anticipate competitive shifts. For ongoing updates, consult primary sources including ethereum.org and established analytics platforms that provide transparent, verifiable data.
No comments yet. Be the first!