 CryptoChain Blog
Introduction to 2026 Ethereum L2 TVL Dynamics
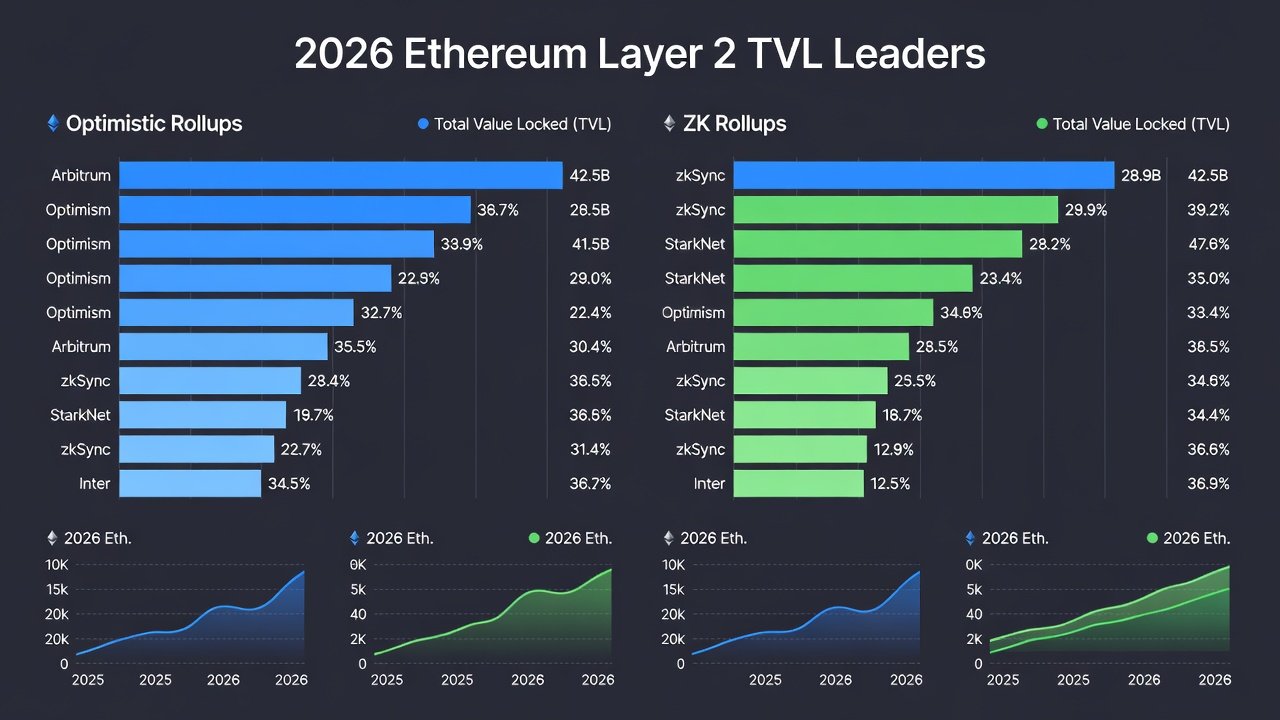
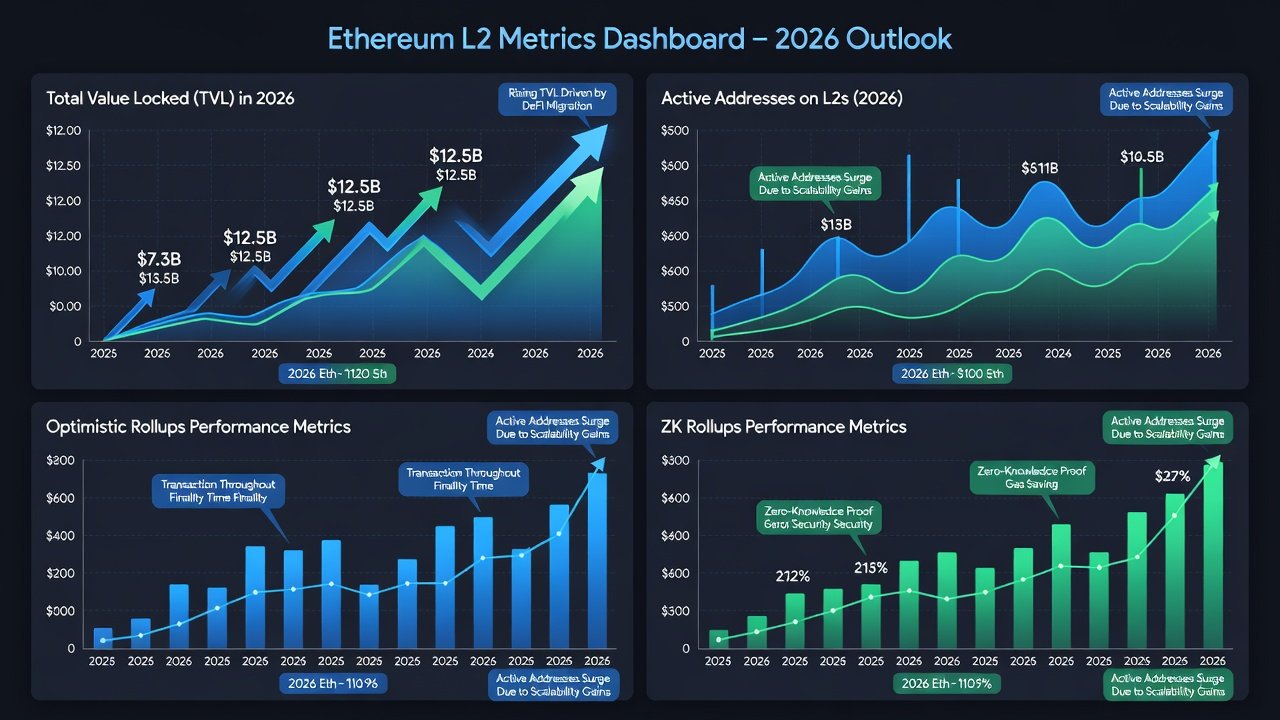
The Ethereum ecosystem continues to evolve rapidly in 2026, with Layer 2 solutions driving the majority of on-chain activity and value locked. Total Value Locked (TVL) across L2s has become a critical metric for assessing network health, user adoption, and competitive positioning among rollups. This analysis examines the leaders in TVL growth, drawing on fresh metrics to compare optimistic and zero-knowledge (ZK) approaches while highlighting institutional inflows and transaction trends. As Ethereum mainnet remains the settlement layer of choice, L2s handle the bulk of user interactions, enabling lower fees and higher throughput that attract both retail traders and large-scale DeFi protocols.
Understanding these shifts helps DeFi participants identify where capital is flowing and how to position for emerging opportunities. Leading protocols demonstrate distinct strengths in scalability, security, and ecosystem development. By examining real-time data from sources such as DefiLlama and L2Beat, analysts can build a clearer picture of which chains are gaining momentum and why.
Optimistic vs ZK Rollups: TVL Breakdown
Optimistic rollups like Optimism and Arbitrum maintain strong positions due to their mature ecosystems and EVM compatibility. In contrast, ZK rollups such as zkSync and Starknet are gaining traction through enhanced privacy and faster finality. Comparisons show optimistic solutions often lead in raw TVL volume, while ZK variants excel in specific DeFi niches like high-frequency trading. The core difference lies in their proof mechanisms: optimistic rollups assume transactions are valid by default and use fraud proofs for challenges, whereas ZK rollups generate validity proofs that confirm correctness upfront.
Key differentiators include fraud proofs versus validity proofs, impacting how each handles disputes and verification. Analysts tracking 2026 data note that ZK solutions are closing the gap in developer activity and user retention. For instance, optimistic chains benefit from easier migration of existing Ethereum smart contracts, while ZK chains offer stronger security guarantees that appeal to institutional players concerned about long-term finality. This dynamic creates a balanced competitive landscape where both approaches coexist and serve different segments of the market.
Institutional Inflows and Active Address Trends
Institutional participation has accelerated L2 adoption, with funds allocating to protocols offering robust security and yield opportunities. Active address metrics reveal spikes in daily unique users, particularly on chains supporting seamless bridging from Ethereum mainnet. Large entities are increasingly bridging assets to L2s for efficient deployment into lending markets, liquidity pools, and restaking protocols. Transaction volume data further underscores growth, with several L2s processing millions of operations daily. These trends signal maturing infrastructure capable of handling real-world financial applications at scale.
Monitoring bridge inflows provides early signals of institutional interest. When combined with rising active addresses, these metrics often precede broader TVL surges. Platforms like Dune Analytics allow users to query these patterns directly, revealing correlations between institutional wallet activity and subsequent ecosystem expansion.
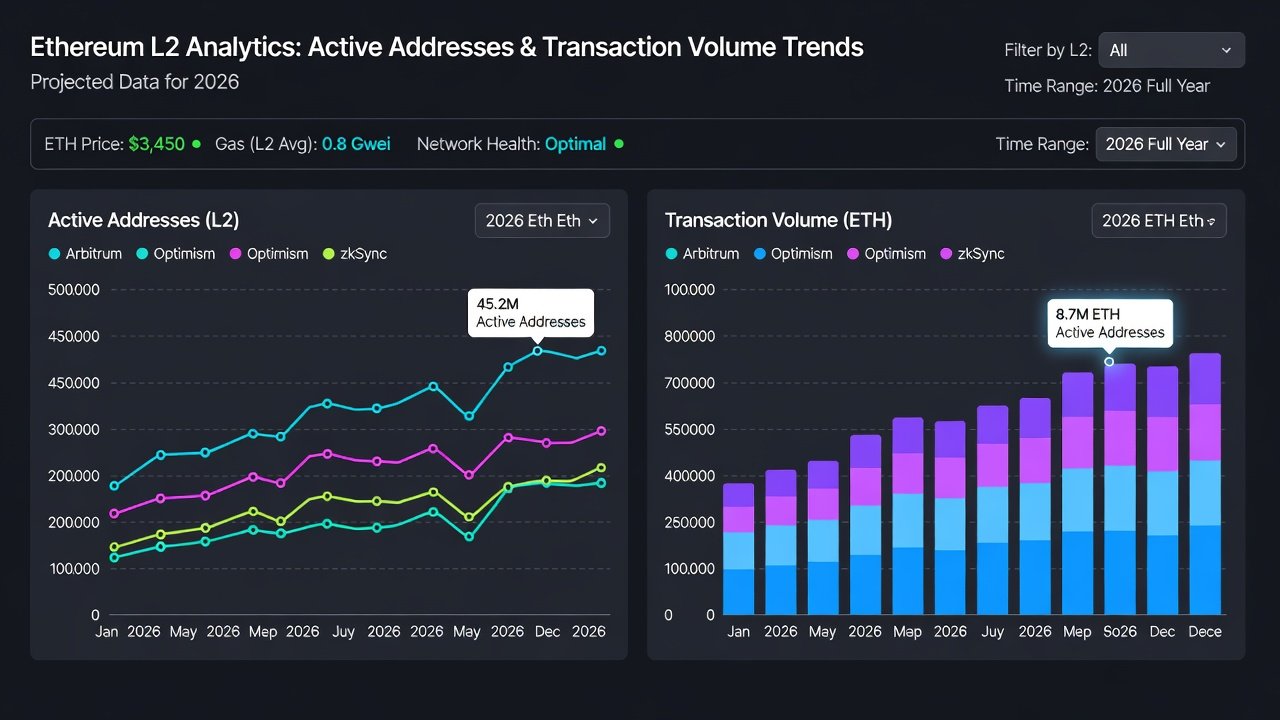
Step-by-Step Guide to Interpreting On-Chain Dashboards
To spot opportunities, follow this practical process:
- Start with aggregated platforms like DefiLlama to view overall TVL rankings and 30-day changes. Pay close attention to category breakdowns such as DEXes, lending, and derivatives to understand where value is concentrated.
- Drill into individual protocol pages for breakdowns by asset type and chain. Compare year-over-year growth to identify sustained momentum versus short-term spikes.
- Cross-reference with Dune Analytics for custom queries on active addresses and volume. Build dashboards that track unique wallets interacting with specific smart contracts over time.
- Monitor bridge inflows via official explorers to detect institutional movements early. Large single transactions from known custodians often indicate upcoming deployments.
- Compare fee structures and throughput against competitors to evaluate sustainability. Factor in sequencer revenue and tokenomics to assess long-term viability.
- Review security audits and upgrade histories on sites like L2Beat before considering deeper involvement in newer chains.
This method reveals undervalued protocols before broader market recognition and helps avoid chains experiencing temporary hype without fundamentals.
Practical Examples from Top Protocols
Arbitrum exemplifies optimistic rollup success with its Orbit chain deployments attracting gaming and DeFi projects. Its Nitro technology stack has enabled developers to launch custom chains quickly while inheriting Ethereum security. Base has leveraged Coinbase integration for rapid user growth, becoming one of the fastest-growing L2s in active addresses during 2026. On the ZK side, Polygon zkEVM demonstrates strong TVL momentum through enterprise partnerships and seamless Ethereum compatibility. zkSync Era continues to expand its ecosystem with account abstraction features that simplify user onboarding for non-crypto natives.
These examples illustrate how targeted features—such as native account abstraction or low-cost swaps—drive both TVL and engagement metrics. Optimism’s Superchain vision further shows how interconnected optimistic rollups can share liquidity and governance, creating network effects that boost overall TVL across the ecosystem.
Spotting Emerging DeFi Opportunities
Focus on chains with rising TVL paired with increasing transaction counts but moderate fees. Watch for new liquidity pools in emerging sectors like restaking or real-world asset tokenization. Institutional inflows often precede yield spikes, creating entry points for retail participants who can provide liquidity early. Cross-chain composability between L2s is another area worth monitoring, as bridges and aggregators improve interoperability.
Always verify data across multiple sources and consider risk factors like smart contract audits before committing capital. Diversifying across both optimistic and ZK solutions can mitigate single-chain risks while capturing growth from different technological approaches.
Common Pitfalls When Analyzing L2 Metrics
Many analysts overlook the distinction between bridged TVL and native TVL, leading to inflated perceptions of certain chains. Another frequent mistake is ignoring sequencer centralization risks, which can affect both security and uptime. Finally, failing to account for token unlock schedules often results in misjudging sustainable yield opportunities.
Conclusion
2026 Ethereum L2 TVL leaders reflect a maturing landscape where both optimistic and ZK solutions contribute to ecosystem resilience. By mastering dashboard analysis and tracking key metrics, analysts can uncover actionable insights that extend beyond surface-level coverage and support informed decision-making in the evolving DeFi space.
FAQ
What is the difference between optimistic and ZK rollups in TVL terms?
Optimistic rollups typically show higher aggregate TVL due to earlier adoption, while ZK rollups prioritize efficiency and are growing faster in niche applications requiring strong privacy or immediate finality.
How do I track institutional inflows on L2s?
Use on-chain analytics tools to monitor large wallet movements and bridge activity from known institutional addresses, often visible through public explorers and Dune dashboards.
Which metrics matter most for spotting DeFi opportunities?
Prioritize TVL growth rate, active addresses, and transaction volume over raw totals for forward-looking signals, while also reviewing fee trends and developer activity.
Are there risks in chasing high TVL chains?
Yes, high TVL can mask concentrated liquidity or centralization risks; always review security audits and governance structures before allocating capital.
How frequently should analysts review L2 dashboards?
Weekly reviews are recommended for active traders, while monthly deep dives suffice for longer-term portfolio positioning.
No comments yet. Be the first!