 CryptoChain Blog
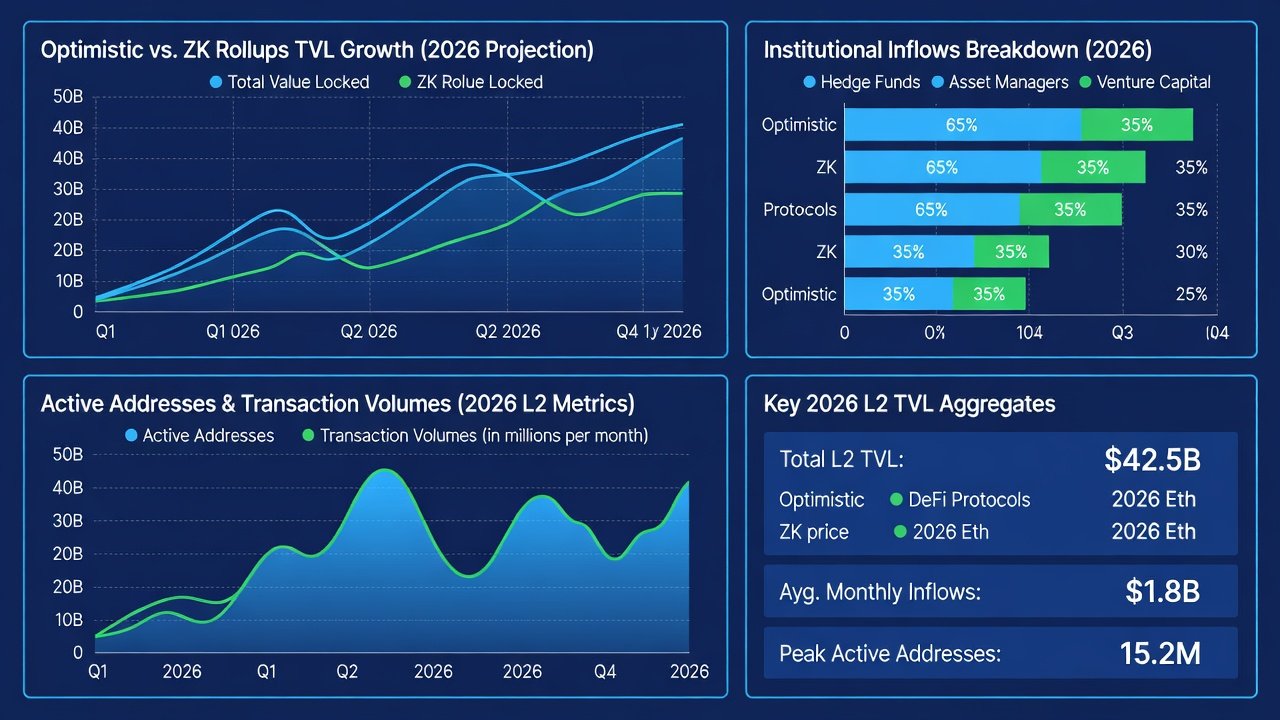
Introduction to 2026 Ethereum L2 TVL Landscape
The Ethereum ecosystem in 2026 continues to evolve rapidly, with Layer 2 solutions driving the majority of on-chain activity and capital allocation. Total Value Locked (TVL) across L2s has become a primary barometer for institutional interest, reflecting both capital inflows and overall ecosystem maturity. This comprehensive analysis draws primarily from L2Beat and Dune Analytics to dissect TVL trends, comparing optimistic and zero-knowledge (ZK) rollups while highlighting institutional adoption patterns across leading networks.
Institutional players from traditional finance (TradFi) are increasingly allocating to Ethereum L2s, seeking scalable, secure environments for tokenized assets, yield strategies, and cross-border settlements. Understanding these metrics in depth allows investors to identify sustainable growth versus speculative spikes, enabling more informed portfolio decisions in a maturing market.
TVL Growth Overview and Key Drivers in 2026
By late 2026, Ethereum L2 TVL reflects a mature market where capital efficiency, security guarantees, and regulatory alignment matter most to large-scale participants. Growth stems from improved bridging mechanisms, significantly lower transaction fees compared to mainnet, and increasing regulatory clarity around tokenized real-world assets such as bonds, funds, and real estate. Data from Dune Analytics dashboards reveal strong correlations between rising active addresses and TVL surges, particularly in ecosystems supporting institutional-grade custody and compliance tooling.
Key drivers include the lasting effects of Ethereum's Dencun upgrade, which dramatically enhanced data availability for rollups, and the proliferation of app-specific and sovereign rollups tailored to enterprise needs. Investors should track not just absolute TVL figures but also the ratio of bridged versus native assets, liquidity depth, and the proportion of TVL locked in governance or staking contracts to gauge genuine long-term adoption versus short-term yield farming.
Optimistic vs ZK Rollups: Detailed TVL and Performance Comparison
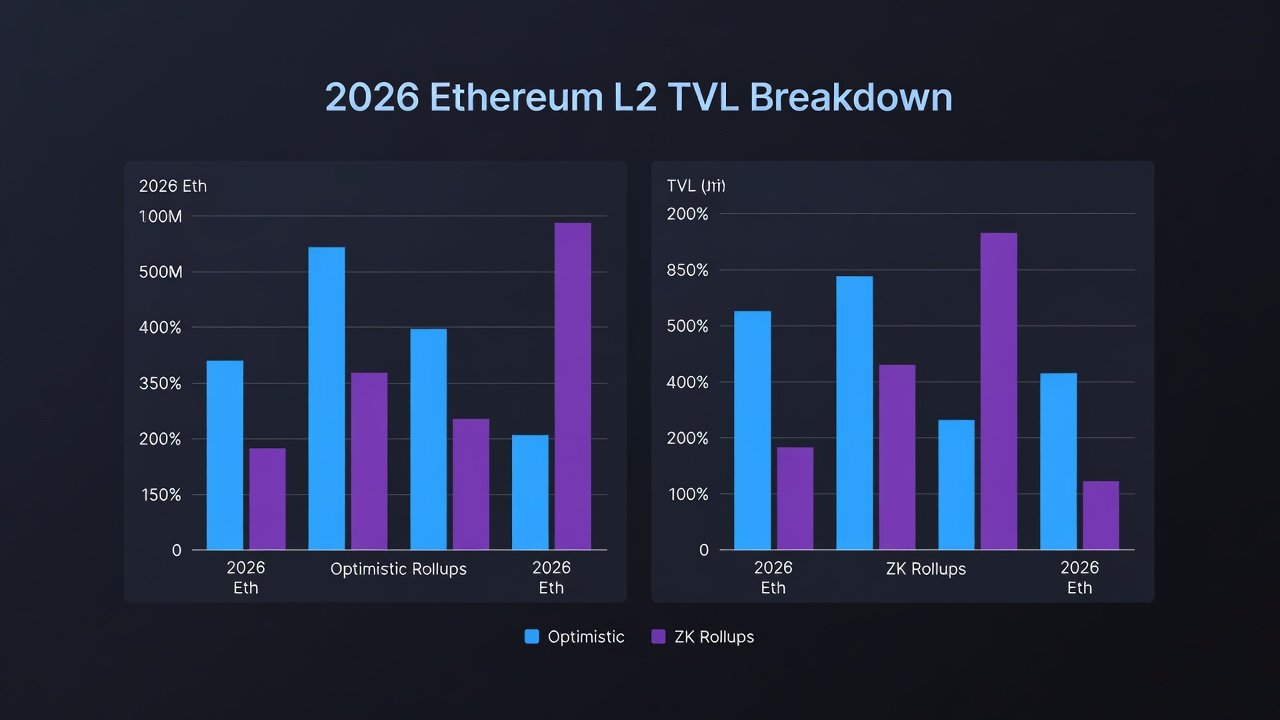
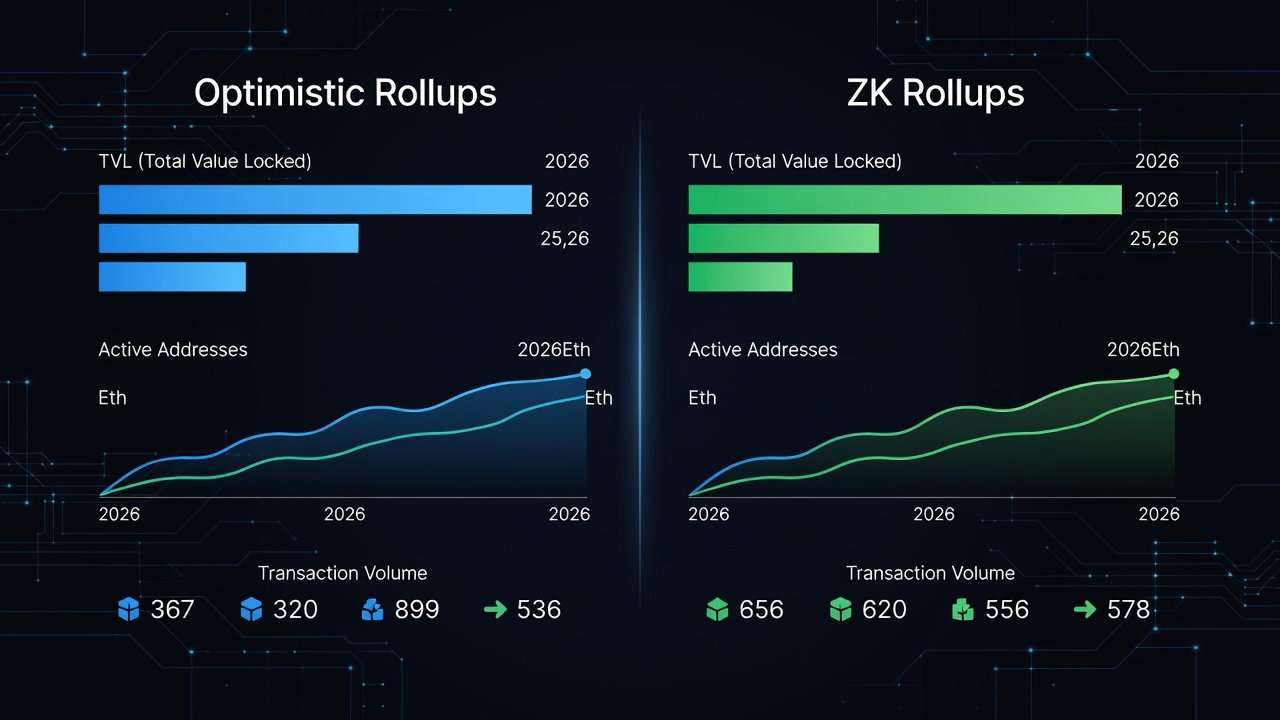
Optimistic rollups such as Arbitrum, Optimism, and Base maintain strong TVL positions due to their mature ecosystems, extensive developer tooling, and broad user bases built over multiple years. These solutions benefit from fraud-proof mechanisms that have proven reliable at scale. However, ZK rollups like zkSync, Starknet, and Polygon zkEVM are rapidly closing the gap with faster finality, enhanced privacy features, and superior scalability that appeal directly to institutions handling sensitive or high-volume transactions.
Side-by-side comparisons show optimistic solutions still leading in raw transaction volume and total unique addresses, while ZK variants demonstrate superior retention of active addresses during market volatility. L2Beat rankings provide weekly standardized breakdowns that investors can cross-reference with custom Dune queries on fee revenue, user retention rates, and TVL composition by asset type. For example, Base has shown consistent TVL expansion tied to consumer-facing applications, whereas zkSync Era attracts more institutional experimentation due to its ZK security model.
Practical steps for analysis include querying Dune for 30-day and 90-day moving averages of TVL per rollup type, then overlaying institutional wallet flows identified via labeled addresses from on-chain analytics platforms.
Institutional Inflows and TradFi Integration Case Studies
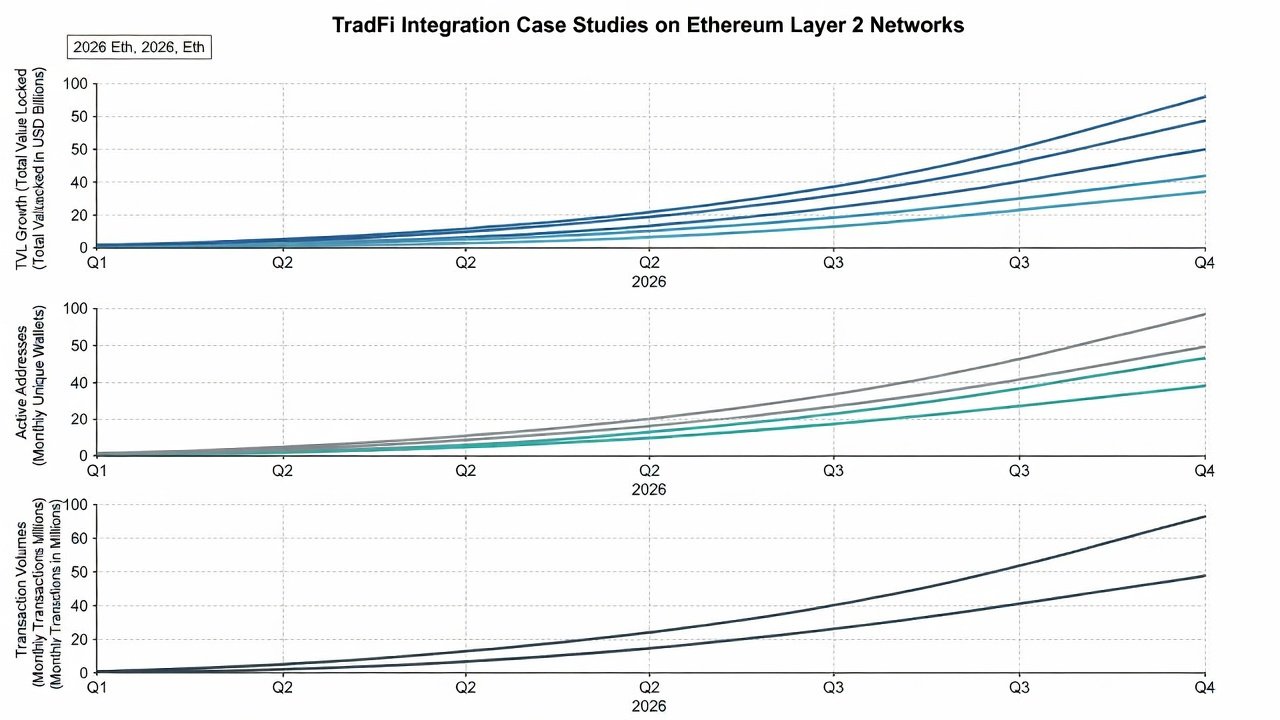
TradFi integration has accelerated markedly in 2026, with banks, asset managers, and payment providers deploying capital into L2-based tokenized funds and settlement layers. Notable case studies include major financial institutions experimenting with on-chain settlement on ZK rollups for compliance advantages, including atomic swaps of tokenized treasuries and automated compliance checks embedded in smart contracts. These inflows often correlate with spikes in high-value transactions rather than retail-driven volume spikes.
User trend correlations indicate that periods of rising institutional addresses coincide with more stable TVL growth curves, reducing overall volatility compared to purely retail-dominated cycles. Monitoring labeled institutional flows on Dune Analytics offers early warning signals of sustained interest or potential outflows ahead of broader market moves.
Additional examples include asset managers tokenizing private credit products on optimistic rollups for seamless integration with existing DeFi protocols, and payment companies leveraging L2s for real-time settlement rails that bypass traditional correspondent banking delays.
Active Addresses, Transaction Volumes, and User Trends Analysis
Beyond headline TVL numbers, active addresses and transaction volumes provide critical context on real usage and network health. 2026 data shows L2s with strong institutional presence maintaining higher average transaction values and lower churn rates among addresses. Retail-driven chains, by contrast, often exhibit greater daily active user fluctuations tied to meme activity or short-term incentives.
Correlations between these metrics and TVL help distinguish organic growth from concentrated holdings. For instance, consistent growth in unique addresses alongside steady TVL increases suggests healthy ecosystem expansion, whereas TVL growth without corresponding address diversity may signal over-reliance on a few large depositors.
Practical Steps for Investors to Interpret Metrics
- Begin with L2Beat for standardized TVL rankings, risk assessments, and technology categorization across all tracked rollups.
- Build custom dashboards on Dune Analytics to track institutional wallet activity, bridging volumes, and fee revenue trends over multiple timeframes.
- Compare optimistic and ZK metrics on a quarterly basis to identify shifting institutional preferences and emerging leaders.
- Cross-reference L2 data with Ethereum mainnet statistics to monitor bridging trends and overall capital migration patterns.
- Monitor for anomalies such as sudden TVL drops without corresponding declines in active addresses or transaction counts, which may indicate temporary liquidity events rather than structural issues.
- Review governance participation rates and treasury diversification as secondary signals of long-term ecosystem health.
Common Mistakes to Avoid When Analyzing L2 Metrics
Investors frequently overemphasize short-term TVL spikes without examining underlying address quality or asset composition. Another common error is ignoring the distinction between optimistic and ZK security models when projecting future scalability. Always validate dashboard data against multiple sources and consider off-chain factors such as team execution and regulatory developments.
Expert Predictions and Future Outlook
Analysts anticipate continued TVL expansion through 2027 as more TradFi entities tokenize assets on L2s and integrate them into existing financial infrastructure. ZK solutions are expected to capture greater market share due to inherent scalability and privacy advantages that align with institutional requirements. Investors should prioritize chains demonstrating both consistent TVL growth and diversified user bases across retail, developer, and enterprise segments.
Short FAQ on Tracking Adoption Signals
How do I track institutional TVL inflows effectively?
Use labeled address queries on Dune Analytics combined with L2Beat TVL breakdowns to isolate large deposits from known institutional entities and monitor their holding periods.
What distinguishes sustainable TVL growth from temporary spikes?
Sustainable growth typically shows steady increases in active addresses, transaction diversity, and retention metrics rather than concentrated large deposits that can exit quickly.
Which metrics best signal genuine institutional adoption?
High-value transaction volumes, 90-day address retention rates, integration with compliant custody providers, and participation in governance proposals are among the strongest leading indicators.
How often should investors review these dashboards?
Weekly reviews of L2Beat rankings paired with monthly deep dives into Dune Analytics custom queries provide an effective cadence for most institutional and sophisticated retail investors.
Conclusion
2026 Ethereum L2 TVL metrics reveal a maturing landscape where institutional adoption is reshaping priorities toward security, compliance, transparency, and operational efficiency. By leveraging established tools like L2Beat and Dune Analytics with disciplined analytical frameworks, investors can make data-driven decisions that separate genuine ecosystem progress from short-lived hype, positioning portfolios for the next phase of Ethereum scaling.
No comments yet. Be the first!