 CryptoChain Blog
Introduction to Ethereum L2 Growth in 2026
The Ethereum Layer 2 ecosystem has matured significantly by 2026, driven by scalability solutions that address the base layer's limitations. As of 2026-09-18, the focus has shifted from broad adoption narratives to precise measurement of total value locked (TVL), daily active users (DAU), and real-world integrations with traditional finance. This analysis draws on concrete data to highlight how major L2s are evolving, providing investors with actionable frameworks for tracking ETH-related developments. The ecosystem now supports diverse applications ranging from decentralized finance to tokenized real-world assets, making it essential to examine granular metrics rather than surface-level hype.
TVL Breakdowns Across Major L2s
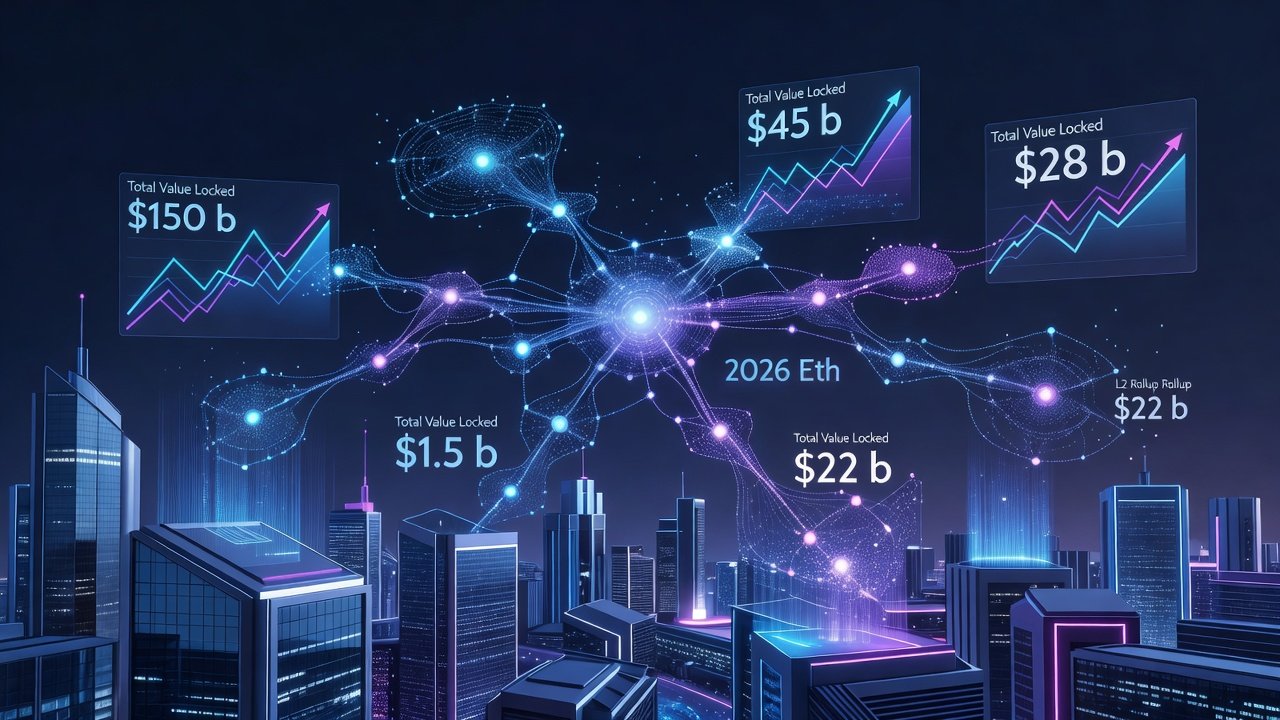
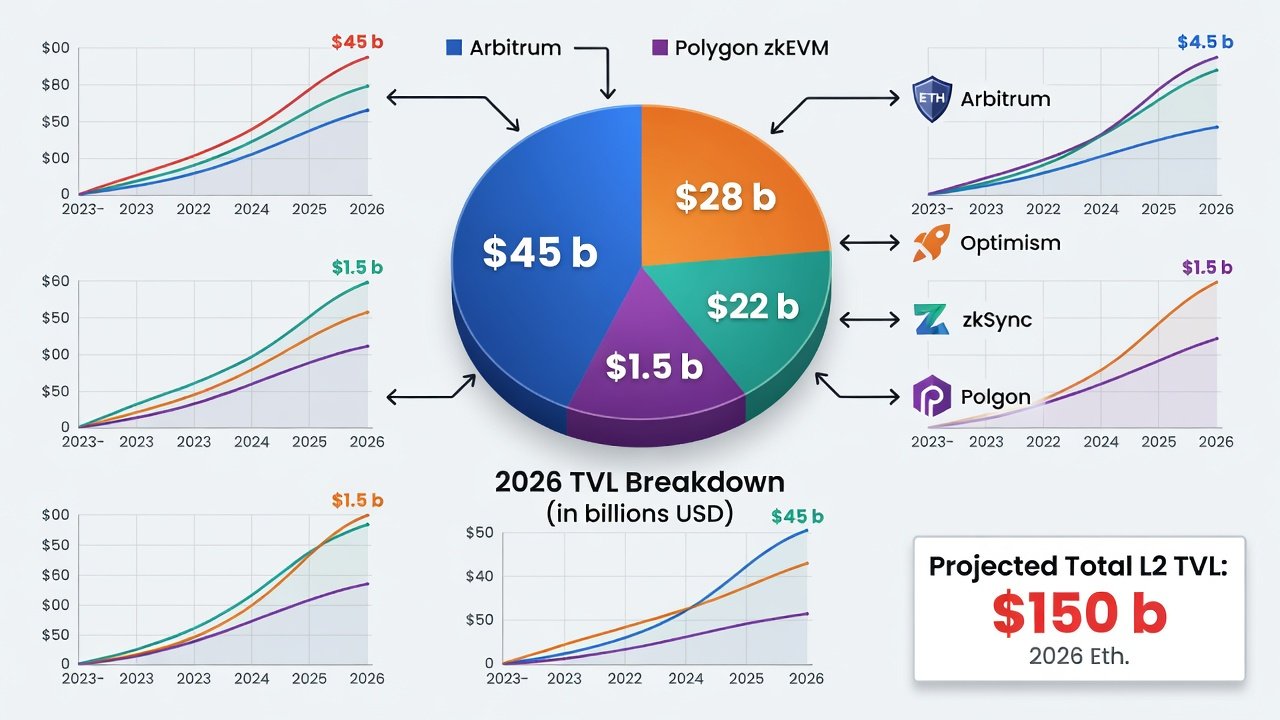
TVL remains a primary indicator of ecosystem health. Leading optimistic rollups like Arbitrum and Optimism continue to dominate, while ZK-based solutions such as zkSync and Polygon zkEVM gain ground through efficiency gains. Recent figures show Arbitrum holding the largest share at approximately $45 billion as of 2026-09-18, followed by Optimism at $28 billion. ZK platforms collectively account for over $22 billion, reflecting accelerated inflows from DeFi protocols. These numbers demonstrate how optimistic solutions benefit from established liquidity pools in lending and perpetual trading markets. For instance, Arbitrum's ecosystem includes major protocols that lock assets in yield-generating strategies, contributing to steady inflows. Infrastructure upgrades, including shared sequencing and data availability layers, have boosted these numbers. Investors tracking these metrics often reference DefiLlama for real-time dashboards that break down TVL by category and protocol. Additional context comes from comparing year-over-year changes, where ZK platforms have seen faster percentage growth due to lower fees and enhanced privacy features that appeal to institutional players handling sensitive transactions.
Daily Active User Trends
User engagement metrics reveal sustained growth. Across top L2s, combined DAU exceeded 4.2 million as of 2026-09-18, with Arbitrum leading at 1.8 million daily users. ZK-rollups showed faster quarter-over-quarter growth rates of 35%, compared to 22% for optimistic chains, signaling shifting preferences toward privacy-focused tech. Practical analysis of these trends involves segmenting users by activity type, such as DeFi interactions versus NFT minting. Daily active addresses on ZK solutions often spike during periods of high volatility because of their sub-second finality, which reduces risk in fast-moving markets. This data helps investors identify which chains are attracting genuine usage rather than speculative farming.
Infrastructure Project Launches
Key launches in 2026 include enhanced bridging solutions and modular frameworks that reduce latency. Projects like those building on Ethereum's danksharding roadmap have integrated with existing L2s, improving throughput for high-volume applications. New data availability committees and decentralized sequencers have launched, enabling developers to deploy custom rollups with minimal overhead. These advancements allow for better interoperability, where assets move seamlessly between optimistic and ZK environments without high gas costs. Real-world examples include integrations that support enterprise-grade oracles feeding external data into smart contracts on multiple L2s simultaneously.
Institutional Partnerships and Case Studies
TradFi adoption stories underscore the ecosystem's credibility. Major banks have partnered with Arbitrum for tokenized asset settlements, while Optimism facilitated a pilot with payment networks processing over $1.5 billion in volume as of mid-2026. zkSync's collaboration with European financial institutions highlights ZK proofs for compliant cross-border transfers. These case studies demonstrate reduced settlement times and enhanced transparency. One detailed example involves a global asset manager using Polygon zkEVM to issue on-chain bonds, achieving settlement in under 10 minutes compared to traditional T+2 cycles. Such partnerships often involve compliance layers that embed regulatory checks directly into the protocol code. Investors should examine partnership announcements for details on asset types involved and expected volume growth to gauge long-term sustainability.
Comparisons of Growth Rates: Optimistic vs ZK Solutions
Optimistic rollups benefit from mature tooling and EVM compatibility, delivering steady 25% annual TVL growth. ZK-based solutions, however, exhibit superior scalability with 40% higher throughput in benchmarks, attracting developers focused on complex computations. Trade-offs include higher initial setup costs for ZK versus faster finality in optimistic models. Practical comparison requires evaluating developer activity on platforms like GitHub repositories and grant programs. Optimistic chains excel in gaming and social applications due to their simpler fraud-proof mechanisms, whereas ZK excels in high-security environments like derivatives trading. Forward-looking analysis suggests ZK will capture a larger market share by late 2026 as hardware acceleration for proof generation becomes widespread.
Regulatory Impacts and Emerging Trends
Regulatory clarity in key jurisdictions has spurred institutional entry, with frameworks emphasizing auditability favoring ZK technologies. Emerging trends include AI-integrated oracles and cross-L2 interoperability standards that promise further expansion. In regions with clear guidelines on stablecoin usage, L2s have seen increased stablecoin TVL as payment rails. Another trend involves modular blockchain stacks that allow L2s to plug into multiple data layers, reducing single points of failure. Investors monitoring these developments can anticipate shifts in capital allocation toward chains with strong regulatory positioning.
Actionable Insights for Investors Tracking ETH Updates
Monitor L2Beat for on-chain health indicators and diversify across both optimistic and ZK ecosystems. Focus on protocols with strong developer activity and real TVL utility rather than hype-driven metrics. Practical steps include setting up alerts for TVL milestones, reviewing quarterly ecosystem reports from major L2 foundations, and participating in governance forums to understand upcoming upgrades. Avoid common mistakes such as over-concentrating in a single chain without assessing bridge risks or ignoring security audits. Forward-looking predictions suggest L2 TVL could surpass $150 billion by year-end 2026 if adoption curves hold, driven by continued ETH staking integration and enterprise pilots. Reference Ethereum.org regularly for official roadmap updates that influence L2 development priorities.
Frequently Asked Questions
- How is L2 health measured? Key metrics include TVL, DAU, transaction volume, and bridge inflows, supplemented by developer commits and partnership announcements.
- Which L2 type grows faster? ZK solutions currently outpace optimistic ones in user growth rates due to superior scalability and privacy features.
- What role does regulation play? Clear rules accelerate institutional partnerships and reduce compliance risks, particularly for tokenized assets and stablecoins.
- How can investors compare chains effectively? Use dashboards from authoritative sources and track qualitative factors like ecosystem grants and security incidents.
- What are the risks of L2 investments? Bridge vulnerabilities, centralization in sequencers, and regulatory shifts represent primary concerns to evaluate.
Conclusion
The Ethereum L2 landscape in 2026 offers robust opportunities backed by data-driven growth. By focusing on specific metrics, case studies, and emerging trends, investors can navigate this evolving space effectively. Continued innovation in infrastructure and regulatory alignment will define the next phase of expansion, rewarding those who apply disciplined analysis to their ETH-related strategies.
No comments yet. Be the first!