 CryptoChain Blog
Introduction to Ethereum L2 Metrics in 2026
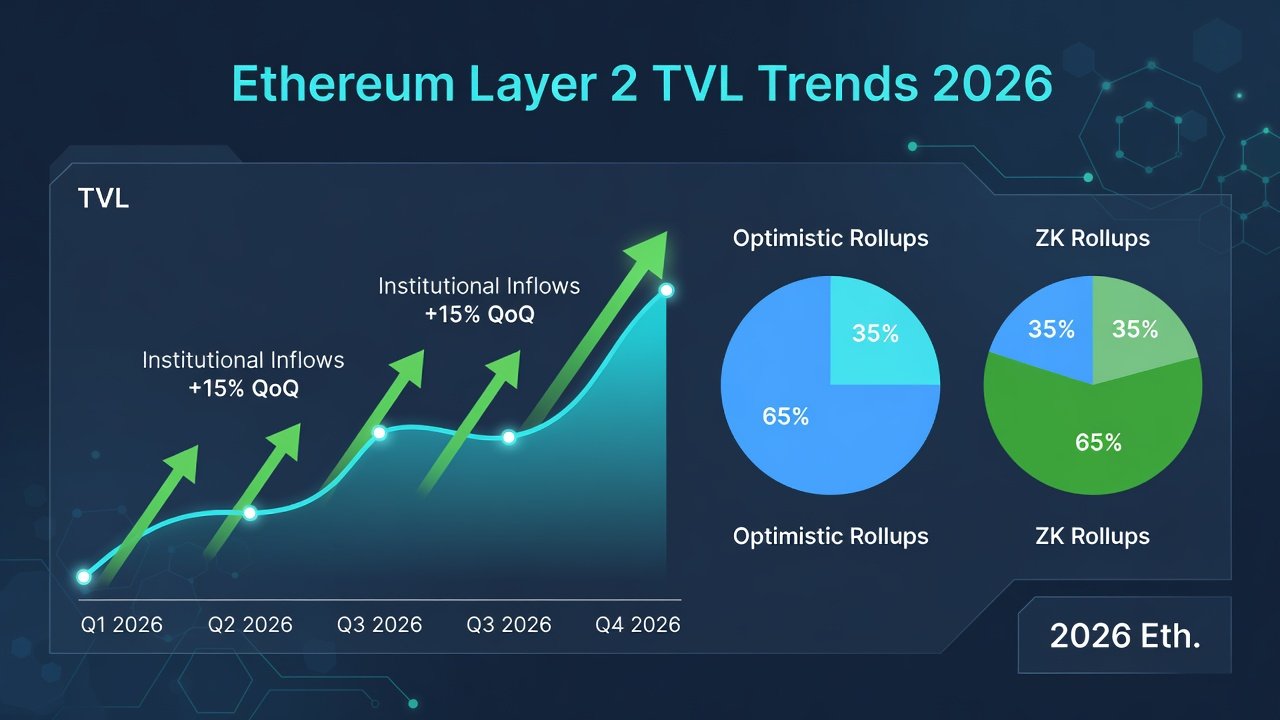
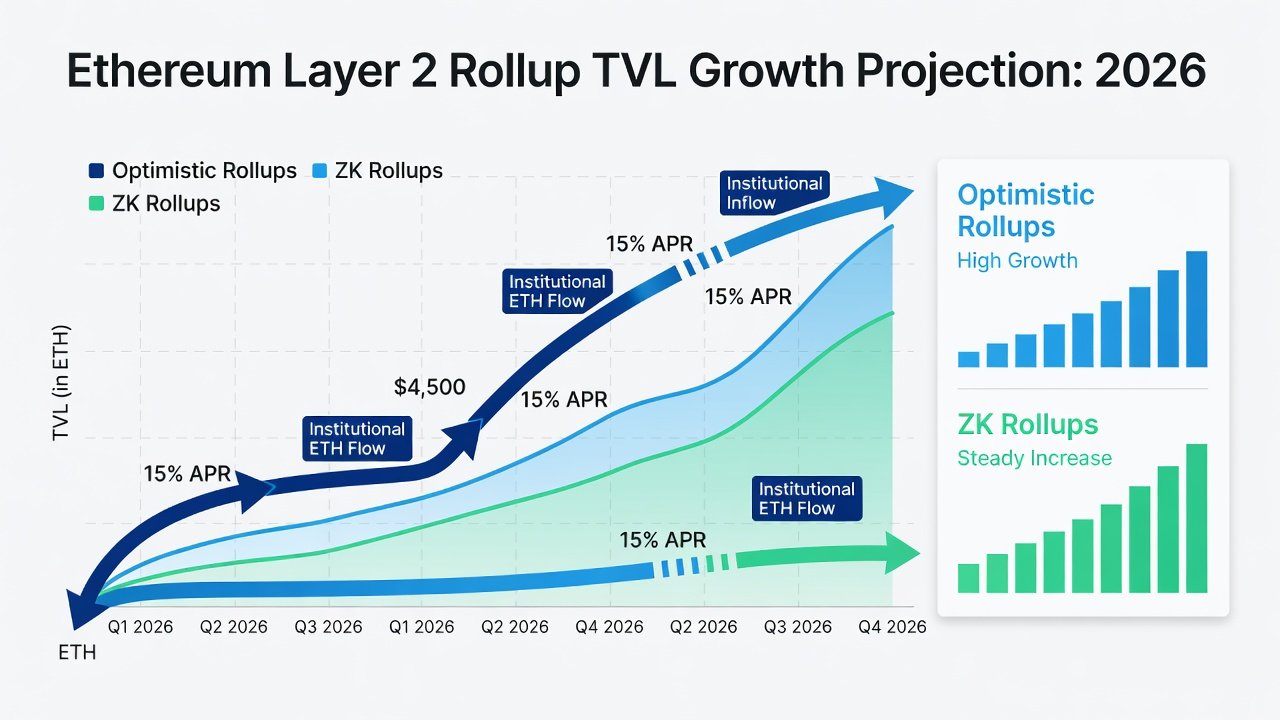
As Ethereum continues to scale through its Layer 2 ecosystem, 2026 marks a pivotal year for tracking total value locked (TVL), user activity, and institutional interest. This analysis draws on data from established platforms to examine trends across rollup types, highlighting how optimistic and zero-knowledge solutions are evolving differently in throughput and retention. The ecosystem has matured significantly since the initial Dencun upgrade, with rollups now handling the majority of Ethereum transactions while maintaining security through the base layer. Investors and developers alike benefit from granular insights into capital flows, engagement patterns, and emerging TradFi partnerships that signal long-term viability.
Understanding these metrics helps investors and developers identify sustainable growth patterns amid expanding TradFi integration. Key sources include comprehensive dashboards that aggregate on-chain activity across networks. In addition to raw TVL figures, analysts examine metrics such as bridged assets, sequencer revenue, and cross-rollup interoperability to form a complete picture. This deeper approach reveals nuances that surface-level data often miss, particularly in distinguishing between organic growth and temporary liquidity incentives.
TVL Breakdowns by Rollup Type
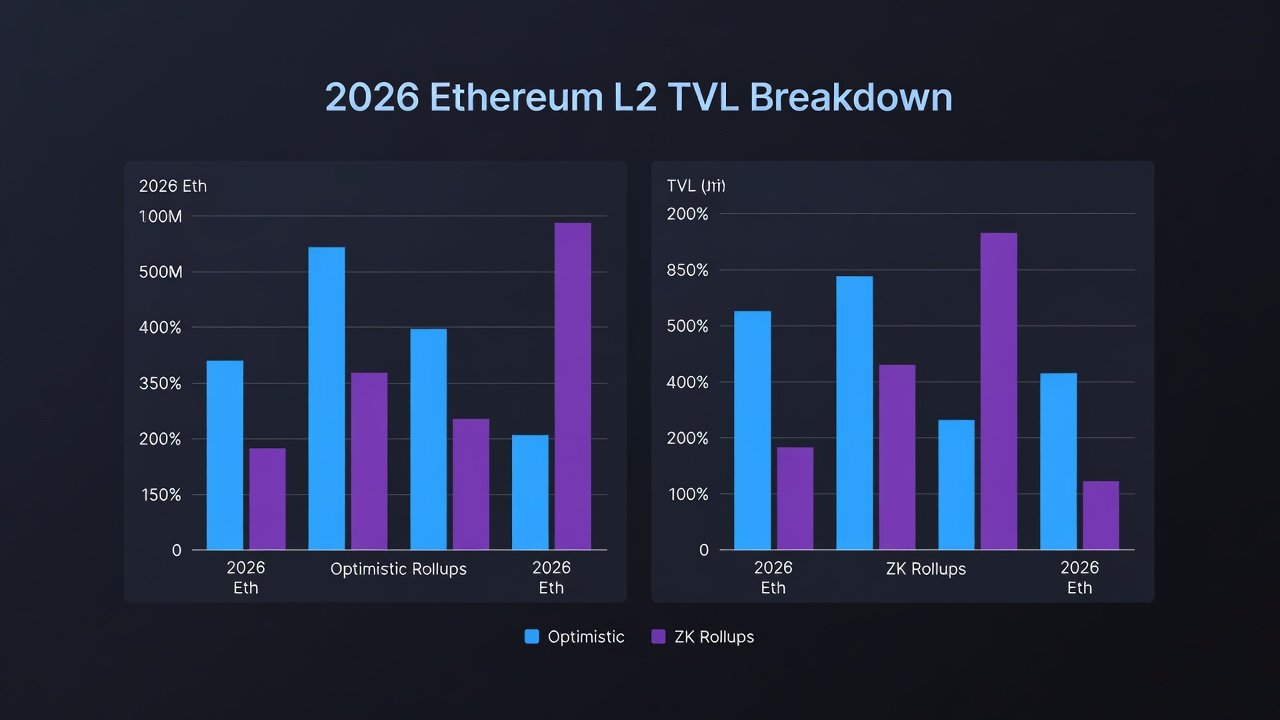
In 2026, TVL distribution reveals distinct patterns between optimistic rollups and ZK-based solutions. Optimistic rollups maintain strong positions in DeFi applications due to mature tooling, while ZK rollups gain traction in high-security environments like payments and NFTs. Data aggregation sites show optimistic chains holding a larger share of general-purpose TVL, whereas ZK variants excel in specialized use cases with lower dispute resolution overhead. For instance, networks focused on gaming and social applications tend to favor optimistic designs for their flexibility in handling complex smart contract interactions.
Breakdowns often categorize by ecosystem focus, such as gaming or enterprise solutions. This segmentation allows for clearer comparisons of capital efficiency and risk profiles across the ecosystem. Recent trends indicate that ZK rollups are attracting more institutional-grade TVL in privacy-preserving protocols, while optimistic rollups dominate in lending and perpetual futures markets. Monitoring these shifts requires regular review of category-specific dashboards to avoid conflating overall growth with sector-specific movements.
Active Address Growth and User Retention
Active addresses serve as a leading indicator of network health. Growth rates in 2026 demonstrate that ZK rollups are closing the gap on optimistic counterparts in daily active users, driven by improved proof generation speeds. Retention metrics, measured through repeat transaction patterns, favor solutions with seamless bridging experiences. Developers increasingly prioritize user experience improvements, such as account abstraction, which has boosted retention across both rollup categories by reducing onboarding friction.
Practical examples include top networks like Arbitrum and Optimism for optimistic approaches, alongside zkSync and Polygon zkEVM for ZK innovations. These platforms illustrate how address growth correlates with developer activity and incentive programs. Retention often improves when networks implement governance mechanisms that reward long-term participation, creating stickier user bases compared to short-term airdrop farming cycles observed in earlier years.
Optimistic vs ZK Solutions: Throughput and Retention Comparison
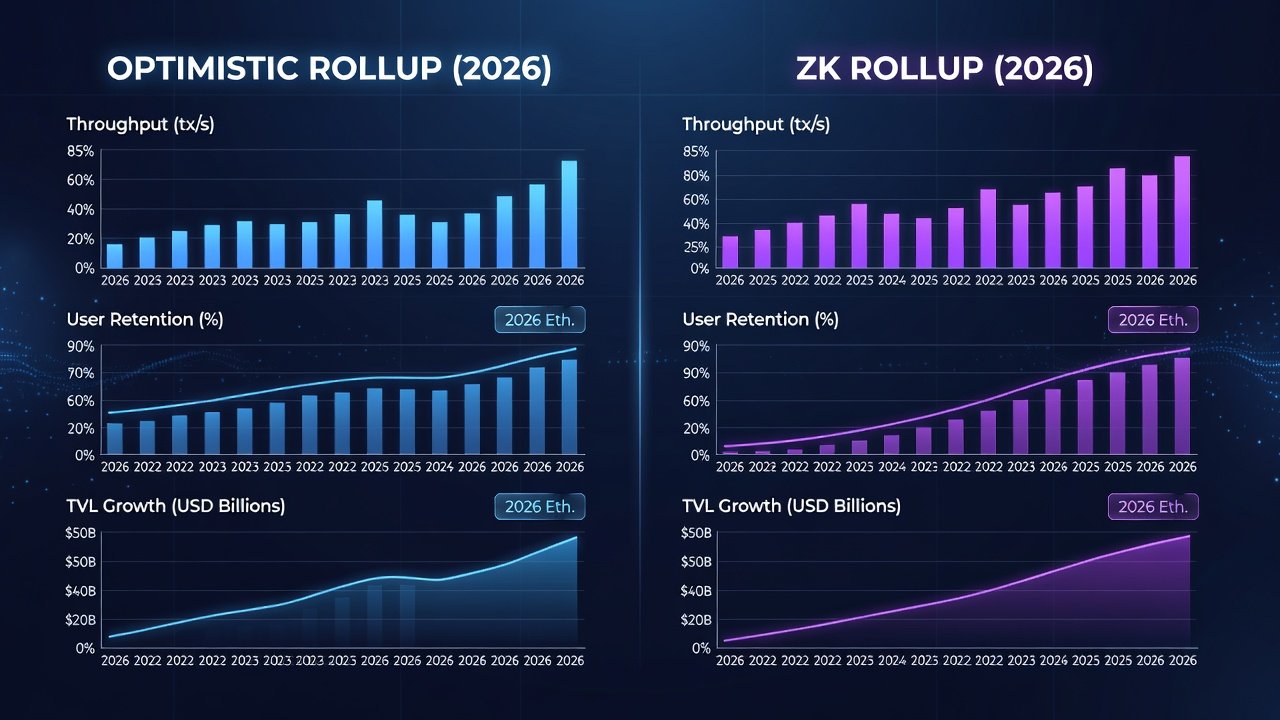
Throughput comparisons in 2026 highlight optimistic rollups achieving higher transactions per second in batch processing scenarios, while ZK solutions provide superior finality times. User retention data from analytics platforms indicates ZK networks retaining users longer in volatile market conditions due to enhanced security guarantees. The choice between the two often depends on application requirements, with optimistic rollups suiting high-frequency trading and ZK excelling in verifiable computation tasks.
Key differences emerge in cost structures and verification mechanisms. Optimistic rollups rely on fraud proofs, offering flexibility but introducing challenge periods, whereas ZK rollups use validity proofs for immediate confirmation. This impacts adoption in time-sensitive applications. Real-world testing shows that hybrid approaches, where optimistic execution pairs with ZK verification for final settlement, are emerging as a middle ground for complex decentralized applications.
TradFi Inflows and Institutional Adoption Patterns
Institutional adoption accelerates as traditional finance entities explore Ethereum L2s for tokenized assets and settlement layers. Patterns show inflows concentrated in networks with robust compliance features and partnerships with custody providers. Emerging trends include banks testing ZK rollups for private transactions and asset managers leveraging optimistic chains for yield-bearing products. Regulatory clarity in several jurisdictions has further encouraged these inflows, with institutions favoring networks that offer transparent reporting and audit trails.
Forward-looking predictions suggest continued diversification, with hybrid models combining both rollup types gaining prominence by late 2026. L2Beat provides ongoing TVL visualizations to monitor these shifts. Institutions are also exploring L2s for cross-border payments and real-world asset tokenization, areas where ZK technology offers competitive advantages in data privacy without sacrificing verifiability.
Practical Examples of Top-Performing Networks in 2026
Arbitrum continues to lead in DeFi TVL concentration, with its Orbit chain deployments enabling customized environments for institutional clients. Optimism has expanded its Superchain vision, fostering interoperability that boosts overall ecosystem retention. On the ZK side, zkSync has demonstrated strong growth in active addresses through its focus on consumer-facing applications, while Polygon zkEVM attracts enterprise pilots due to its Ethereum equivalence and scalability features.
These examples highlight how network-specific strategies influence metric performance. Developers evaluating new projects should examine not only headline TVL but also the distribution across protocols and the quality of developer tooling available.
Step-by-Step Metric Interpretation Guide
- Start with TVL trends on dashboards to gauge overall capital commitment and identify seasonal patterns.
- Cross-reference active address data for engagement quality, paying attention to unique wallet growth versus repeat usage.
- Compare throughput metrics against competitors to assess scalability under peak load conditions.
- Analyze retention rates for long-term viability indicators, including cohort analysis where available.
- Incorporate institutional flow reports to identify TradFi momentum and potential regulatory impacts.
- Review governance and treasury metrics to evaluate sustainability beyond short-term incentives.
This structured approach enables informed decisions when evaluating L2 opportunities and helps avoid over-reliance on any single data point.
Common Pitfalls When Analyzing L2 Metrics
One frequent mistake is treating TVL as a standalone success metric without considering asset concentration or withdrawal risks. Another involves ignoring the impact of incentive programs on address growth, which can inflate short-term numbers. Analysts should also watch for discrepancies between reported and verifiable on-chain data, especially during periods of high market volatility.
Using multiple data sources mitigates these issues. Combining on-chain queries with qualitative assessments of team execution and roadmap delivery provides a more balanced view.
Forward-Looking Predictions for 2026 and Beyond
Analysts anticipate ZK dominance in privacy-focused sectors, while optimistic rollups sustain leadership in DeFi volume. Broader Ethereum upgrades will further enhance interoperability, potentially boosting overall ecosystem TVL. Monitoring Dune Analytics queries remains essential for real-time insights into these developments. Scenarios include accelerated institutional entry if regulatory frameworks solidify, or slower growth if interoperability challenges persist across rollups.
Conclusion
Ethereum L2 metrics in 2026 underscore a maturing landscape where data-driven analysis reveals clear winners in specific niches. By focusing on TVL, addresses, and adoption signals, stakeholders can navigate opportunities with greater precision and prepare for the next phase of ecosystem evolution.
FAQ: Interpreting L2 Metrics for Investment Decisions
How do I interpret TVL changes? Rising TVL often signals growing confidence, but pair it with address growth to avoid inflated figures from single large deposits or temporary liquidity mining.
What distinguishes optimistic from ZK retention? ZK solutions typically show stronger retention in security-sensitive use cases due to instant finality and reduced dispute risks.
Are institutional inflows reliable indicators? They provide directional signals but require verification against on-chain data from sources like Ethereum.org for accuracy and context.
Which metrics matter most for long-term holds? Combine throughput, retention, and adoption patterns for a holistic view rather than relying on TVL alone.
How can I customize metric tracking? Leverage platforms like Dune Analytics to build personal dashboards that track specific rollup cohorts over time.
No comments yet. Be the first!