 CryptoChain Blog

Introduction to Ethereum L2 Performance Analysis
As Ethereum continues its scaling journey in 2026, Layer 2 solutions play a critical role in handling increased network demand. Understanding how to analyze L2 performance metrics is essential for developers, users, and investors seeking to optimize operations and assess ecosystem health. This guide provides actionable workflows to track key indicators amid ongoing network growth. Effective analysis starts with grasping core metrics and reliable data sources. By the end of this article, you will have practical steps to build monitoring systems and interpret trends that directly influence transaction efficiency and ETH utility. The rapid expansion of rollups and sidechains has created a diverse ecosystem where performance can vary dramatically between solutions, making consistent measurement practices more important than ever before.
With Ethereum mainnet continuing to serve as the settlement layer, L2s must balance speed, security, and cost. Users who master metric analysis gain an edge in choosing the right network for specific applications, whether that involves decentralized finance, gaming, or enterprise solutions. This comprehensive approach goes beyond surface-level observations to deliver decision-useful insights.
Core Metrics for Evaluating L2 Efficiency
Three primary metrics define L2 performance: throughput, finality times, and cost per transaction. Throughput measures transactions processed per second and reflects an L2's capacity to scale beyond Ethereum's base layer. In practice, throughput is often expressed as transactions per second (TPS) averaged over rolling windows such as one hour or one day. Developers monitor both peak and sustained throughput to identify bottlenecks during high-demand periods.
Finality times indicate how quickly transactions become irreversible, impacting user experience in DeFi and gaming applications. Shorter finality reduces the risk of chain reorganizations and improves confidence in transaction outcomes. Cost per transaction captures fees paid in ETH or stablecoins, directly affecting adoption rates. These three metrics are interconnected; improvements in one area often influence the others. For example, higher throughput can sometimes increase finality latency if the proof generation process becomes more complex.
These metrics collectively signal the overall health of the Ethereum ecosystem. High throughput paired with low costs typically indicates robust L2 adoption, while prolonged finality times may highlight congestion or security trade-offs. Monitoring changes over weeks and months reveals whether an L2 is maturing or facing scaling challenges as total value locked and user activity grow throughout 2026.
Selecting Reliable Data Sources
Choosing accurate sources is the foundation of credible analysis. Start with established platforms that aggregate on-chain data across multiple L2s. L2Beat provides standardized dashboards for activity and risk metrics. Supplement this with Ethereum.org documentation for protocol-level details on scaling solutions. For deeper querying, integrate Dune Analytics to build custom SQL queries on L2 data. Additional context can come from explorers that index specific rollups and provide raw transaction logs for verification.
Always cross-reference multiple sources to avoid single-point biases. Verify data freshness, as 2026 network upgrades can rapidly shift metrics. When selecting sources, prioritize those that publish methodology documents explaining how they calculate each metric. This transparency helps you understand any sampling biases or normalization techniques applied to the raw blockchain data.
Setting Up Monitoring Dashboards
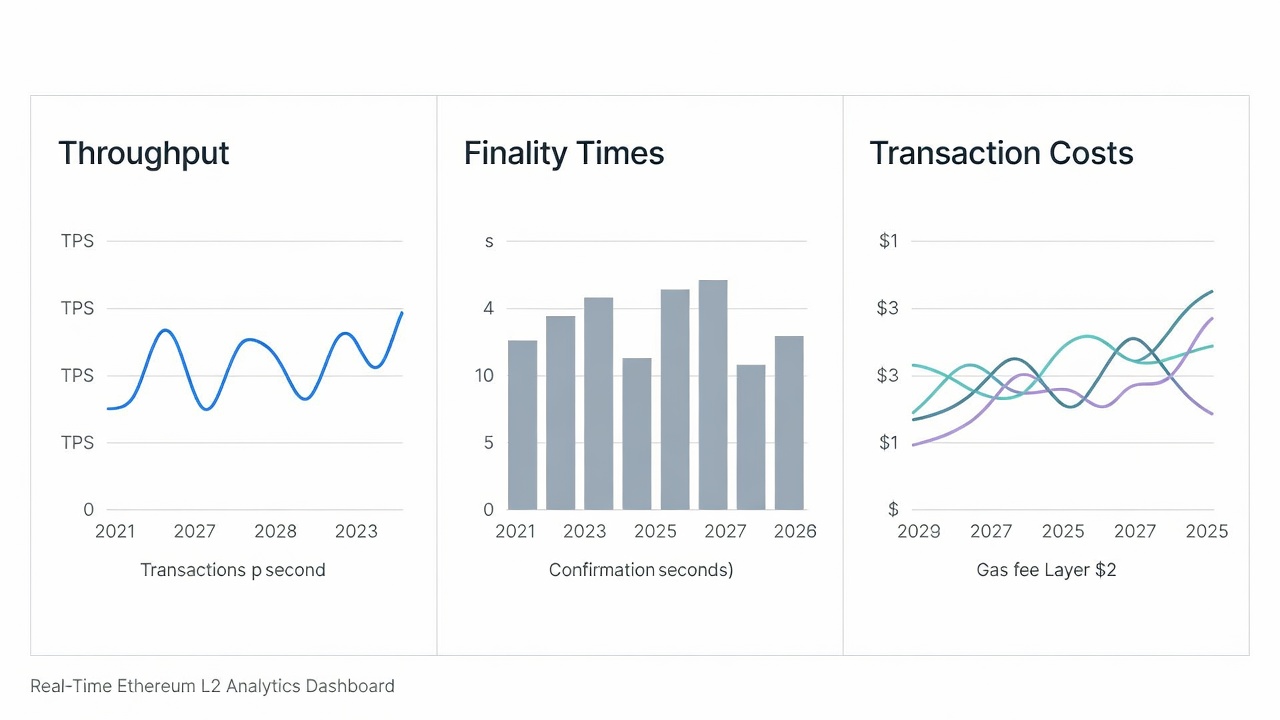
Building a personal dashboard enables real-time tracking. Begin by connecting APIs from L2Beat or Dune to visualization tools like Grafana or Google Looker Studio. Create panels for each core metric: line charts for throughput trends, histograms for finality distributions, and bar graphs for comparative costs. Include filters that allow segmentation by time of day, transaction type, or specific L2 network.
Step-by-step setup example: 1) Export CSV data from L2Beat for your target L2. 2) Import into a spreadsheet or BI tool. 3) Configure alerts for threshold breaches, such as finality exceeding 2 minutes. 4) Schedule daily refreshes to capture 2026 growth patterns. 5) Add derived calculations such as throughput-to-cost ratios to surface efficiency trends. 6) Test the dashboard with historical data from the past quarter to validate accuracy. This workflow allows immediate application to your ETH operations and can be extended to include mobile notifications for critical events.
Interpreting Real-Time Charts with Examples
Real-time charts reveal actionable insights when read correctly. For throughput, look for sustained upward trends rather than spikes. In a 2026 example, an L2 showing 150 TPS average with low variance indicates stable scaling suitable for high-volume applications. Watch for sudden drops that may coincide with sequencer downtime or data availability issues.
Finality charts should display tight clusters near zero latency. Cost charts help identify fee spikes during peak hours. Compare daily versus weekly views to distinguish noise from meaningful shifts. Avoid overreacting to single outliers without context from broader market activity. Consider overlaying multiple L2 datasets on the same chart to spot relative performance changes during network-wide events such as major protocol upgrades.
Another practical technique involves creating ratio metrics, such as cost per finalized transaction, to normalize data across networks with different security assumptions. This helps when deciding whether an L2's performance justifies its risk profile for your specific use case.
Side-by-Side L2 Comparisons Using 2026 Data
Popular L2 networks demonstrate varied performance profiles. Optimism and Arbitrum often lead in throughput for optimistic rollups, while zkSync and Starknet excel in finality speed due to zero-knowledge proofs. Cost per transaction remains lowest on mature optimistic solutions during moderate load periods. Newer zk-rollups continue to close the gap on throughput while maintaining strong security guarantees through validity proofs.
When evaluating, factor in security models and ecosystem maturity. Use these comparisons to decide which L2 aligns with specific use cases like high-frequency trading or NFT minting. Maintain a living document that records weekly snapshots of key metrics so you can track improvement trajectories rather than relying on single-point observations. This comparative discipline becomes especially valuable as more L2s launch and compete for liquidity and developer mindshare throughout 2026.
Common Pitfalls and How to Avoid Them
- Misinterpreting throughput without accounting for data availability layers.
- Ignoring finality variability during network upgrades.
- Relying solely on average cost figures instead of median and percentile data.
- Failing to adjust for differences in proof systems when comparing optimistic and zk-rollups.
- Overlooking the impact of batch posting frequency on overall user experience.
Regularly validate assumptions against multiple data sources to maintain accuracy and update your models as new L2 features are released.
FAQ
How often should I refresh L2 metrics?
Refresh dashboards at least hourly during active trading periods and daily otherwise to stay aligned with 2026 network dynamics.
What indicates a healthy L2?
Consistent high throughput, sub-minute finality, and stable low costs relative to Ethereum mainnet signal strong performance and growing adoption.
Can these metrics predict price movements?
While useful for ecosystem health, metrics alone do not forecast ETH prices; combine them with broader market analysis and on-chain fundamentals.
How do I handle missing data from certain L2s?
Use interpolation techniques for short gaps and note longer outages as potential risk indicators in your analysis reports.
Should I weight metrics differently for various use cases?
Yes. Gaming applications may prioritize low finality times while DeFi protocols often emphasize cost efficiency and throughput consistency.
Conclusion
Mastering Ethereum L2 performance analysis empowers better decision-making in a rapidly evolving 2026 landscape. Apply the workflows outlined here to build robust monitoring practices that enhance your ETH operations and contribute to a healthier ecosystem overall. Consistent measurement and thoughtful interpretation remain the most reliable path to informed participation in the expanding Layer 2 ecosystem.

No comments yet. Be the first!