 CryptoChain Blog
Introduction: The Data-Driven Evolution of NFT Trading in 2026
In 2026, NFT marketplaces have evolved far beyond simple digital art galleries. Big data analytics now powers every aspect of discovery, pricing, and trading decisions. Traders who leverage volume trends, user behavior patterns, and predictive modeling consistently outperform those relying on intuition alone. This guide provides practical, actionable insights for using analytics to maximize wins while minimizing risks across platforms like OpenSea and Blur. The integration of advanced analytics has transformed how collectors and traders approach the market, turning subjective decisions into data-backed strategies that improve success rates over time.
Core Metrics That Matter in NFT Analytics
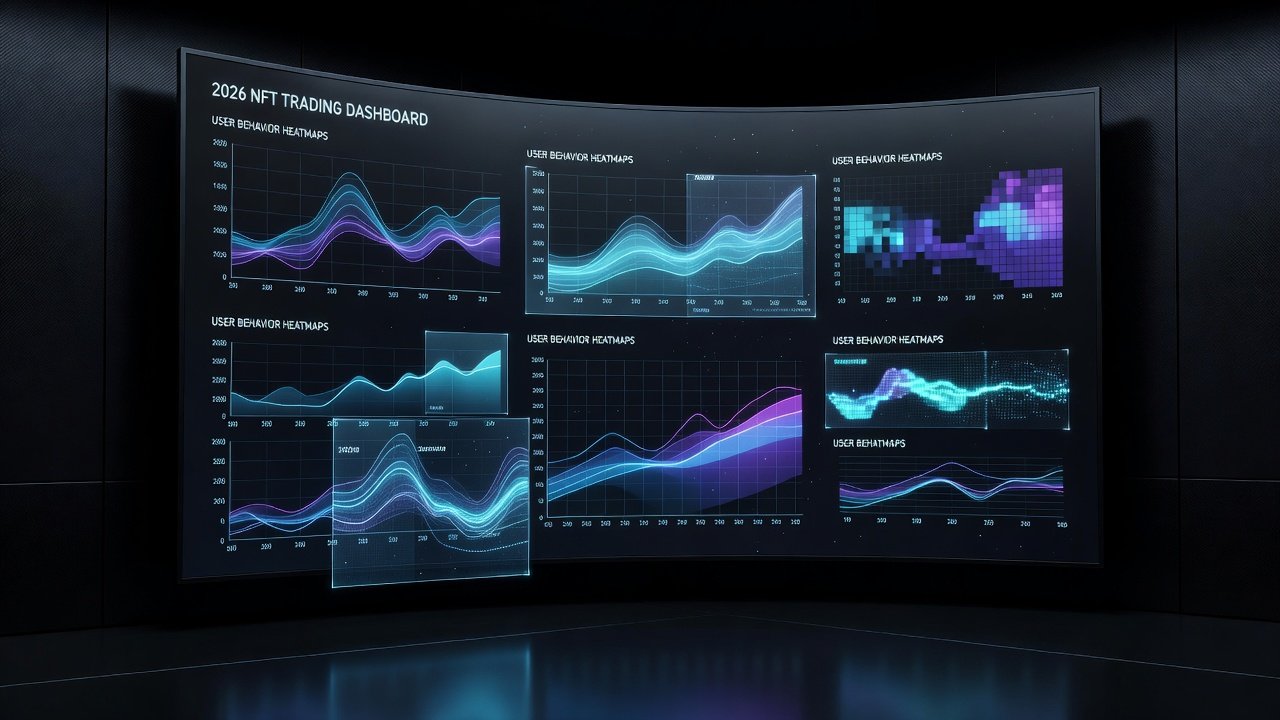
Successful NFT traders monitor several key metrics to gain a competitive edge. Volume trends reveal market momentum, showing which collections are gaining traction and which are fading. User behavior data tracks wallet activity, holding periods, and engagement rates, providing insights into long-term holder loyalty. Floor price movements combined with liquidity indicators help identify undervalued assets before they surge. By analyzing these in real time, traders can spot opportunities and avoid pitfalls that less informed participants encounter.
Volume Trends and Liquidity Signals
Daily and weekly trading volume data allows identification of breakout collections. High volume paired with increasing unique buyers often signals sustainable growth rather than temporary hype. Traders should cross-reference volume spikes with on-chain transaction patterns to filter out artificial inflation caused by wash trading.
User Behavior and Retention Patterns
Advanced platforms now track metrics like average session duration and repeat purchase rates. These insights help predict which users will become long-term holders versus flippers. Retention-focused analytics also reveal optimal timing for re-listing assets based on historical buyer return patterns.
Additional Metrics: Holder Distribution and Sentiment Correlation
Beyond basic volume, examining holder concentration prevents overexposure to manipulated collections. Sentiment analysis from social platforms combined with on-chain data creates a fuller picture of market psychology, allowing traders to anticipate shifts before they appear in price charts.
Platform Comparison: OpenSea Versus Blur in 2026
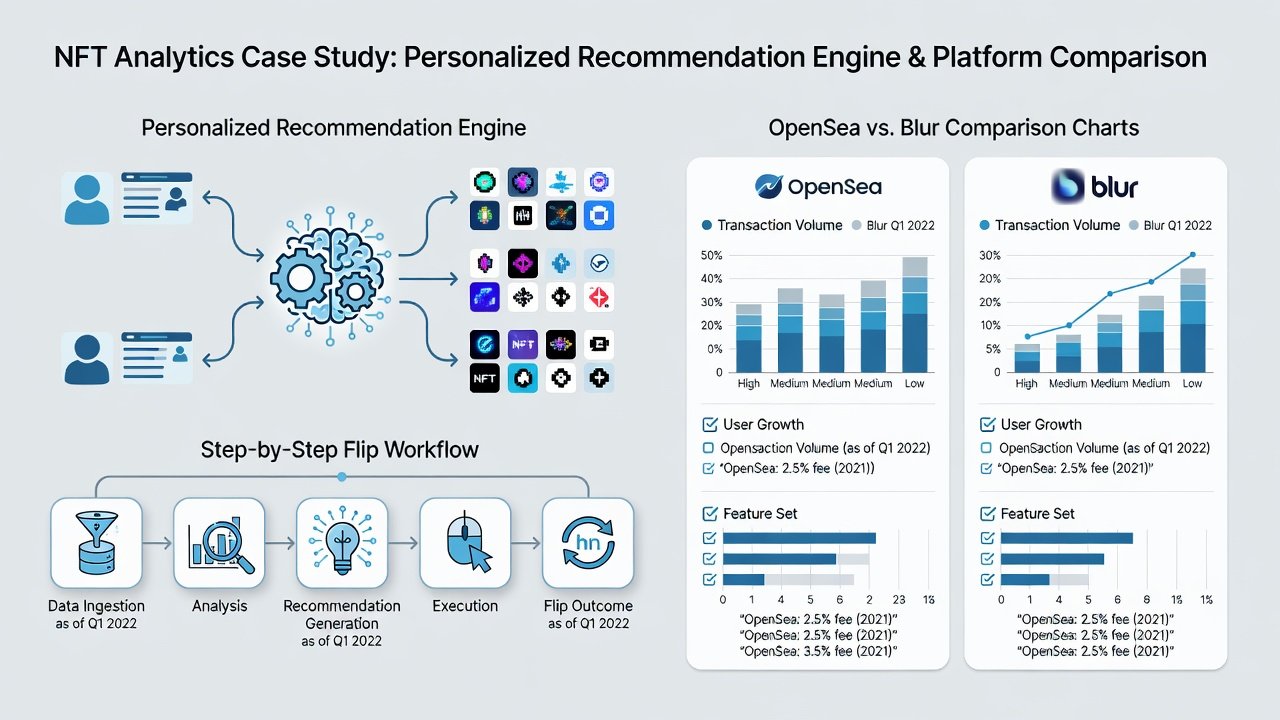
OpenSea remains the largest marketplace with extensive historical data and robust analytics dashboards that cater to both beginners and institutions. Blur, favored by professional traders, offers superior tools for high-frequency trading and real-time bidding analytics that integrate directly with wallet activity. While OpenSea excels in broad discovery features and curated collections, Blur provides deeper on-chain insights for serious volume traders seeking precise entry and exit points. Comparing both platforms side-by-side reveals that hybrid strategies often yield the best results, with many successful traders maintaining accounts on both to leverage unique strengths.
Step-by-Step Examples of Data-Informed NFT Flips
Consider this practical workflow for executing informed flips. First, pull volume data from the past 30 days to identify collections with rising interest but stable holder bases. Next, analyze holder distribution to ensure no single wallet dominates supply, which could indicate manipulation risk. Then, review social sentiment signals alongside on-chain activity to confirm organic demand. Finally, execute a timed entry with predefined exit points based on historical resistance levels and set automated alerts for key metric changes. This methodical approach has helped traders improve flip success rates significantly by reducing emotional decision-making.
Another example involves using behavioral data for timing. A trader might notice a collection with high repeat buyer rates but low overall volume, indicating a loyal community primed for growth. By layering this with floor price stability metrics, the trader can enter early and hold through the initial surge before flipping at peak liquidity periods.
Case Study: Personalized Recommendations Powered by Analytics
Leading marketplaces now deploy machine learning models that analyze past purchases, browsing history, and wallet correlations to deliver tailored suggestions. One notable case involved a mid-tier collection that saw a substantial volume spike after the platform highlighted it to users with similar past acquisitions in adjacent categories. These systems improve both trader retention and marketplace revenue through smarter matching. The case demonstrated how personalized feeds reduced discovery time by over 40 percent for active users while increasing average transaction values through better alignment with individual preferences.
A second case study focused on a gaming NFT project where analytics identified cross-collection synergies. Users who held assets from one game were recommended complementary items from another, leading to higher engagement and repeat trading activity across the ecosystem.
Risk Alerts and Common Pitfalls to Avoid
- Over-reliance on volume without checking for wash trading activity that distorts true market interest
- Ignoring gas fee fluctuations that can erase small profits on low-value trades
- Failing to diversify across multiple collections and risk categories
- Neglecting regulatory updates that may affect liquidity and platform availability
- Disregarding wallet age and activity history when evaluating new entrants to a collection
FAQ: Free Analytics Tools for NFT Traders
What free tools provide reliable NFT volume data?
Platforms like Dune Analytics and public blockchain explorers offer accessible dashboards for tracking NFT metrics without subscription costs. These resources allow users to query historical trends and build custom visualizations tailored to specific collections.
How can beginners start with on-chain analysis?
Begin with wallet tracking tools and free API endpoints from major marketplaces to build foundational datasets before advancing to paid solutions. Consistent daily review of a few key collections builds intuition alongside the data.
Are there limitations to free analytics platforms?
Free tools often lack real-time alerts and advanced filtering, so traders should combine multiple sources such as Dune Analytics and direct marketplace APIs for comprehensive coverage.
Building a Sustainable Data-First Trading Routine
Developing a routine involves setting daily review periods for volume and behavior metrics, weekly deep dives into platform comparisons, and monthly audits of past trades against analytical predictions. This structured approach ensures continuous improvement and adaptation to evolving market conditions in the 2026 landscape.
Conclusion: Building a Data-First Trading Strategy
Integrating big data analytics into your NFT trading routine is no longer optional in 2026. By focusing on volume trends, user behavior, and platform-specific tools, traders can achieve better discovery and stronger retention of winning positions. Start small, validate each data point with multiple sources, and always maintain disciplined risk management to sustain long-term success in this dynamic market.
No comments yet. Be the first!