 CryptoChain Blog
2026 NFT Updates: Marketplace Analytics Tools for Traders
In 2026, NFT trading has evolved into a data-intensive discipline where success hinges on timely insights rather than intuition alone. Traders who master analytics platforms gain an edge by monitoring real-time sales trends, identifying undervalued assets, and refining exit strategies across major marketplaces. This guide examines how intermediate users can harness these tools to navigate evolving NFT news and optimize decisions in an increasingly competitive landscape.
Why Analytics Matter in 2026 NFT Marketplaces
The NFT ecosystem continues to mature with increased institutional participation and cross-chain activity. Without robust data, traders risk missing volume spikes or misjudging holder distribution shifts that signal upcoming momentum. Analytics platforms aggregate on-chain data, providing visualizations that turn raw blockchain information into actionable intelligence. As marketplaces like OpenSea and Blur integrate more sophisticated APIs, the ability to interpret trends in holder concentration and liquidity has become essential for avoiding common traps such as wash trading or sudden liquidity drains.
Market volatility remains high, and data-driven approaches help separate genuine collection growth from temporary hype. Traders who ignore these signals often find themselves holding assets during prolonged downturns, while those equipped with the right dashboards can pivot quickly to emerging opportunities.
Key Metrics Every Trader Should Track
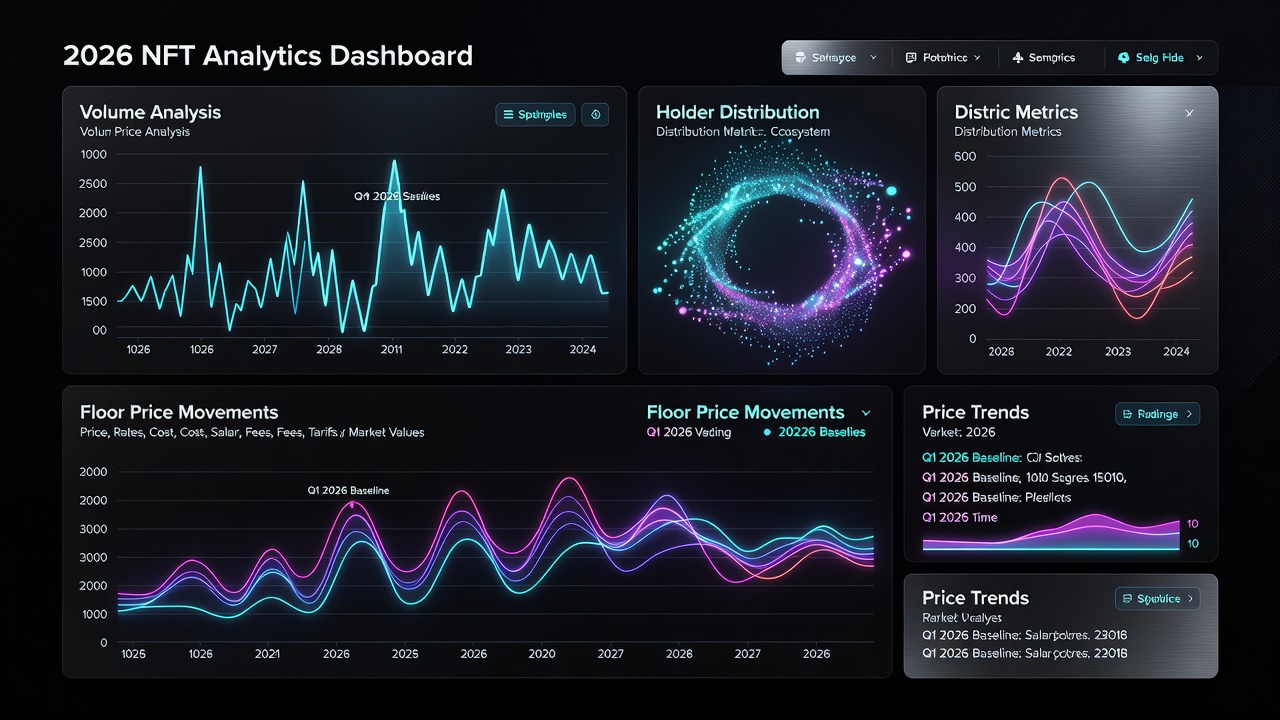
Effective decision-making starts with understanding core metrics. Volume spikes reveal sudden interest in collections, often preceding price surges. Holder distribution analysis shows concentration risks—when a few wallets control large portions, volatility can increase. Floor price movements track the lowest listed price, serving as a baseline for entry points and sentiment shifts.
- Volume trends over 24 hours, 7 days, and 30 days, including breakdowns by marketplace
- Unique holder growth rates and retention percentages
- Floor price volatility percentages and historical ranges
- Whale wallet accumulation patterns and large transaction alerts
- Average sale price versus median to detect outlier influence
- Listing-to-sale ratios indicating supply pressure
These indicators help traders filter noise from genuine opportunities in fast-moving markets. For instance, a sharp rise in unique holders combined with steady volume often points to organic community growth rather than coordinated manipulation.
Popular Analytics Platforms and Their Features
Several established tools dominate the space. Platforms like those integrated with OpenSea offer built-in dashboards, while specialized services provide deeper on-chain breakdowns. Users can compare free tiers, which deliver basic volume and floor data, against premium subscriptions that unlock advanced alerts and historical modeling. Other notable options include tools focused on Ethereum and Solana ecosystems, each with unique strengths in tracking cross-chain transfers and royalty distributions.
Step-by-Step Setup for Popular Tools
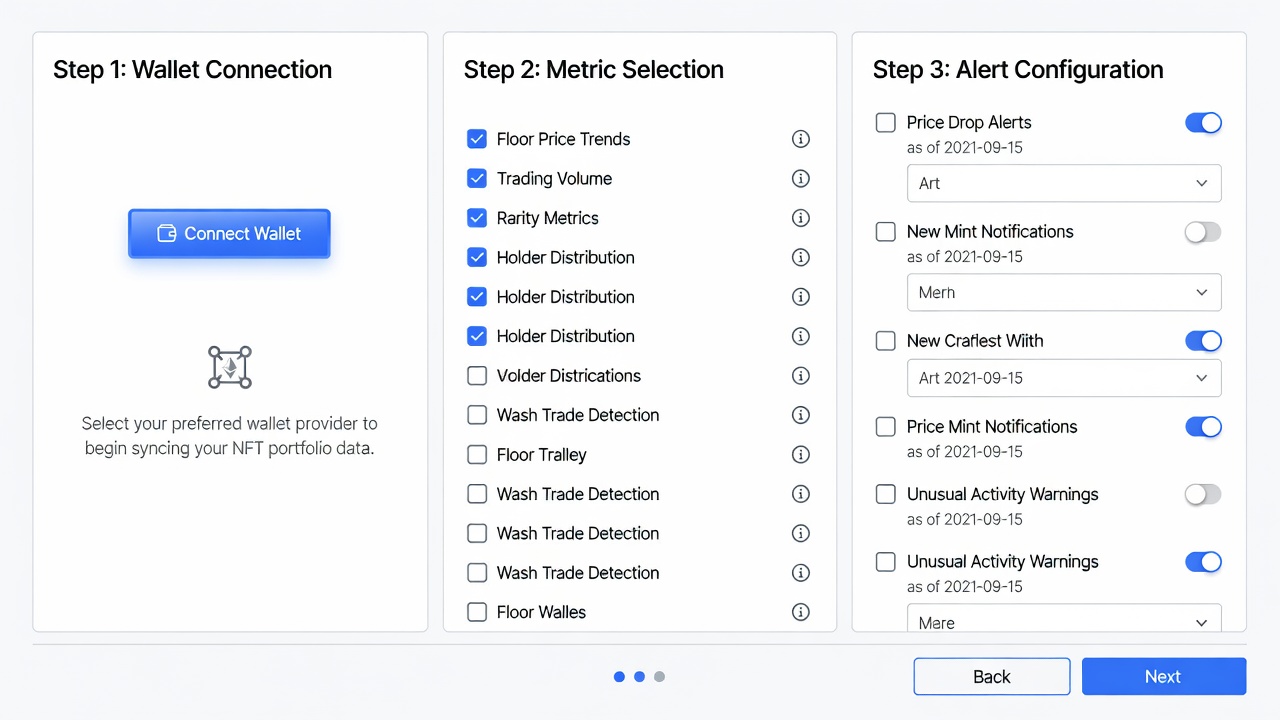
Begin by connecting your wallet to the analytics dashboard using secure wallet-connect protocols. Next, select target collections and set custom alerts for volume thresholds or floor price changes exceeding five percent. Import historical data to calibrate models, then enable cross-marketplace syncing to monitor activity on multiple venues simultaneously. Configure API keys for automated reporting and test the entire workflow with small test transactions before committing real capital. Review data sources for accuracy by cross-referencing with blockchain explorers during the initial setup phase.
Free Versus Premium Features Comparison
Free versions typically cover real-time floor prices and basic volume charts, making them suitable for beginners monitoring a handful of collections. Premium plans add predictive analytics, API access for custom bots, detailed holder segmentation, and priority support during peak market hours. Traders report that premium tools accelerate research cycles by providing machine-learning-driven forecasts, though free options suffice for casual monitoring and initial screening. The decision often comes down to trading frequency—high-volume traders benefit most from the expanded feature sets available in paid tiers.
Case Studies: Improved ROI Through Data-Driven Strategies
One trader used holder distribution alerts to spot an emerging blue-chip collection before its floor price rose dramatically, allowing an early entry that yielded substantial returns after community-driven volume increases. Another avoided a project showing early signs of distress by tracking sudden whale exits and declining unique holders over a two-week period. A third example involves a trader who combined volume spike detection with floor price trend analysis to time exits perfectly during a market correction, preserving gains that would have otherwise been lost. These examples illustrate how metrics translate directly into preserved capital and higher returns when applied consistently across different market conditions.
Advanced Strategies for Intermediate Traders
Beyond basic monitoring, intermediate users can layer multiple data streams to create composite signals. For example, combining whale activity with social sentiment indicators helps confirm whether large purchases represent accumulation or distribution. Setting up automated workflows that trigger notifications when specific metrics cross predefined thresholds reduces emotional decision-making. Traders should also explore backtesting strategies using historical data exports to validate their approach before live implementation.
Common Pitfalls and Integration Tips
Many users overlook data lag during high-traffic periods or fail to cross-verify on-chain signals with off-chain sentiment from community channels. Integrate tools into existing workflows by exporting reports to spreadsheets and combining them with portfolio trackers. Always maintain multiple data sources to reduce single-point failures. Regular audits of alert settings prevent notification fatigue, and documenting each trade's rationale based on specific metrics builds a personal knowledge base for future reference.
Conclusion
Mastering NFT marketplace analytics in 2026 requires consistent practice and a willingness to adapt as platforms evolve. By focusing on the metrics and tools outlined above, traders can develop repeatable processes that improve outcomes over time.
FAQ
How often should I check analytics dashboards?
Daily reviews work well for active traders, while weekly summaries suit longer-term holders seeking to minimize screen time without missing major shifts.
Can free tools deliver competitive insights?
Yes, for foundational metrics such as volume and floor prices, though premium unlocks often justify the upgrade during volatile periods when advanced alerts provide timely advantages.
What is the best way to combine multiple platforms?
Use API connections where available and set unified alerts across services for streamlined monitoring, ensuring all data feeds are synchronized to avoid conflicting signals.
Are on-chain metrics always reliable?
They provide strong signals but should be validated against marketplace-specific activity and broader market trends to account for temporary anomalies or data delays.
How do I handle cross-chain NFT tracking?
Choose platforms with native multi-chain support and configure separate dashboards for each blockchain to maintain accurate visibility across ecosystems.
What mistakes do new analytics users commonly make?
Over-reliance on single metrics and neglecting to backtest strategies are frequent errors that can be avoided through structured learning and gradual implementation.

No comments yet. Be the first!