 CryptoChain Blog
Introduction to Onchain Tokenomics Analysis for RWAs in 2026
Real-world asset (RWA) tokenization has matured significantly by 2026, bridging traditional finance with blockchain infrastructure. Onchain analysis provides transparent insights into token economics that traditional reports often obscure. This guide examines how to evaluate supply dynamics, liquidity pools, and holder behaviors using publicly available blockchain data. Investors and analysts can use these methods to assess project sustainability and risks. By diving deep into verifiable onchain signals, stakeholders gain an edge in identifying projects with robust economic models versus those prone to manipulation or collapse. The growing adoption of RWAs across credit, real estate, and commodities demands rigorous evaluation frameworks that go beyond surface-level metrics.
Understanding Supply Dynamics in RWA Tokenomics
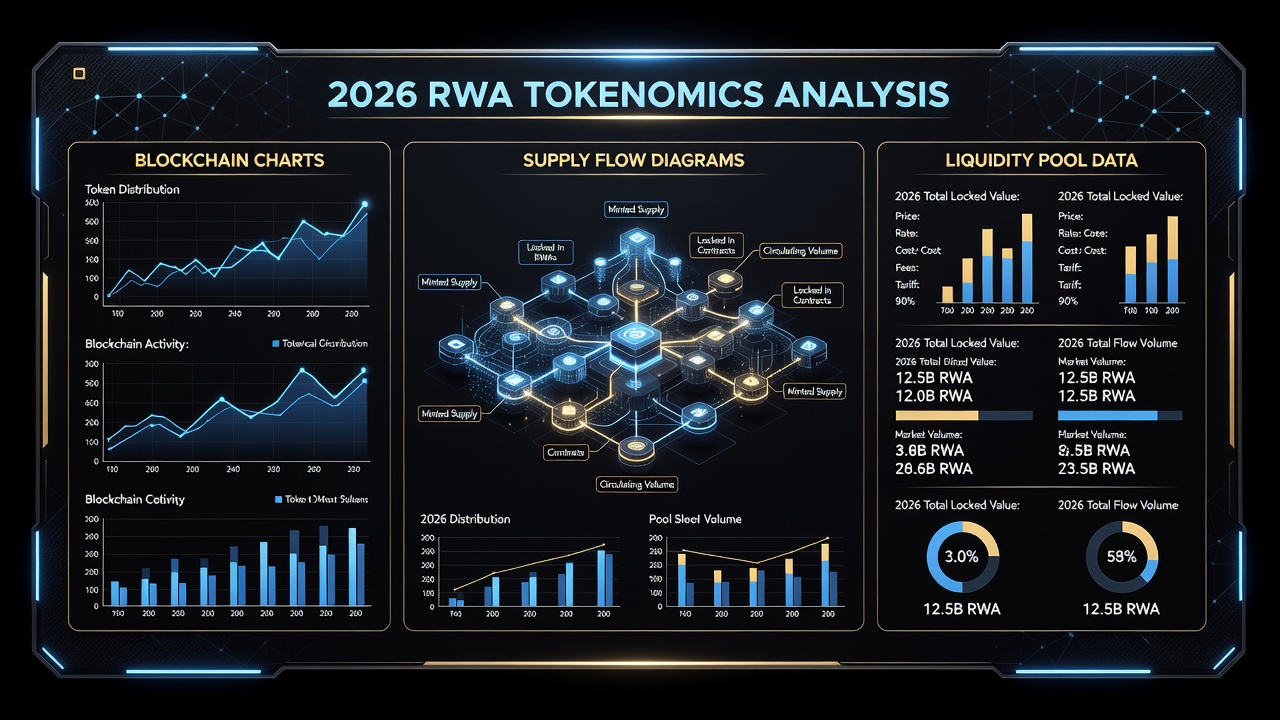
Token supply mechanics form the foundation of any RWA project evaluation. Circulating supply, total supply, and maximum supply figures reveal inflation pressures and scarcity signals. Onchain data from explorers shows real-time minting and burning events tied to asset inflows. Projects often implement dynamic supply adjustments linked to collateral verification, ensuring that token issuance remains backed by tangible assets. Analysts must distinguish between organic supply growth driven by new asset inflows and artificial inflation from governance decisions. For example, a sudden mint event without corresponding asset deposits can signal governance capture or operational issues.
Key metrics include unlocked versus locked portions. Analysts track how token releases align with real asset performance. For instance, projects often tie additional minting to verified collateral deposits, creating a direct link between onchain activity and offchain value. Monitoring emission schedules helps predict future supply shocks and their potential impact on token valuation.
Analyzing Liquidity Pools and Market Depth
Liquidity pools determine how easily tokens trade without massive slippage. In 2026, leading RWA protocols integrate with decentralized exchanges and centralized venues. Onchain queries reveal pool compositions, fee accruals, and impermanent loss exposure for liquidity providers. Depth charts and order book data onchain allow users to assess resilience against large trades. Projects with shallow pools may experience extreme volatility even on modest volume, undermining their utility as investment vehicles.
Practical evaluation involves monitoring pool TVL trends and concentration among top providers. Healthy pools show diversified participation and consistent trading volume relative to market cap. Cross-referencing liquidity metrics with offchain order flow from traditional markets provides a fuller picture of true market depth.
Holder Behaviors and Distribution Patterns
Holder distribution data uncovers concentration risks and community strength. Large wallet clusters may indicate institutional custody or whale accumulation. Onchain tools segment holders by balance tiers and track transfer velocities. Velocity spikes often precede major price movements, serving as early warning indicators. Long-term holding patterns versus frequent trading activity further differentiate speculative projects from those attracting genuine asset-backed usage.
Behavioral signals include staking participation rates and governance voting activity. Projects with broad, active holder bases tend to exhibit greater resilience during market stress. Tracking delegation patterns in governance tokens reveals who truly controls protocol direction and whether decisions favor long-term holders or short-term speculators.
Step-by-Step Examples of Querying Token Flows
Follow these practical steps to analyze token flows on major chains:
- Identify the token contract address via official documentation or block explorers.
- Use query interfaces to filter transfer events over specific time periods, focusing on inflows from custodians and outflows to exchanges.
- Calculate velocity by dividing total transfer volume by average circulating supply to gauge economic activity levels.
- Cross-reference with vesting contract addresses to isolate scheduled releases from organic movements, using timestamp filters for precision.
- Visualize results in dashboards to spot anomalies such as sudden large transfers or unusual clustering of activity across multiple wallets.
- Export raw event logs for further statistical analysis, including correlation with external market events or asset price feeds.
These queries help distinguish organic growth from engineered supply changes. Advanced users can combine multiple data sources such as event logs and state changes for multi-dimensional flow mapping.
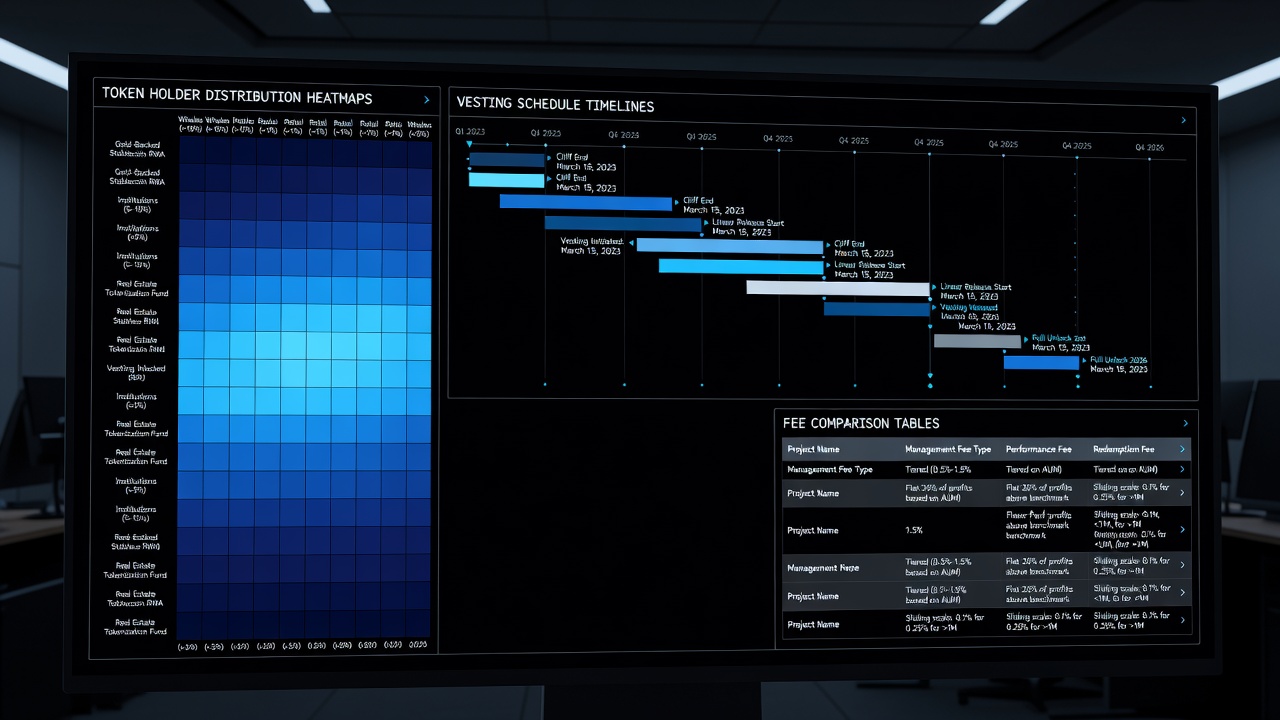
Detecting Concentration Risks Through Onchain Metrics
Concentration risk arises when a small number of addresses control disproportionate supply. Calculate the Gini coefficient or top-10 holder percentage directly from onchain snapshots. Thresholds above 60% in top holders often warrant deeper investigation into custody arrangements. Repeated interactions between high-balance addresses may indicate coordinated entities or custodial services that could trigger simultaneous liquidations.
Additional red flags include dormant wallets with large balances and repeated transfers between related addresses. Regular monitoring prevents surprises from coordinated selling pressure. Integrating onchain concentration data with offchain ownership disclosures provides the most reliable risk assessment.
Analyzing Vesting Schedules and Unlock Events
Vesting schedules dictate the pace at which tokens become available, directly influencing market supply over time. Onchain analysis involves inspecting smart contract parameters for cliff periods, linear unlocks, and milestone-based releases. By querying historical unlock transactions, analysts can forecast upcoming supply increases and assess their alignment with project milestones such as new asset origination or revenue milestones.
Transparent projects publish vesting contract source code and allow independent verification of unlock logic. Discrepancies between stated schedules and actual onchain releases represent major red flags that can erode investor confidence rapidly.
Comparing Fee Structures Across Leading RWA Protocols
Fee models directly impact net yields for token holders. Common structures include issuance fees, management fees, and redemption fees. Transparent protocols publish these onchain or via verifiable smart contracts. Understanding fee accrual mechanisms helps determine whether costs are fairly distributed or disproportionately burden retail participants.
Here is a comparison of three major projects:
| Project | Issuance Fee | Management Fee | Redemption Fee | Key Advantage |
|---|---|---|---|---|
| Ondo Finance | 0.15% | 0.25% annual | 0.10% | Strong institutional custody integration |
| Centrifuge | 0.20% | 0.50% annual | 0.15% | Decentralized asset origination focus |
| Maple Finance | 0.10% | 0.40% annual | 0.05% | Flexible pool structures for credit RWAs |
Always verify current parameters through protocol dashboards, as fee schedules can evolve with governance proposals. Comparing fee impacts across different market conditions reveals which structures maintain competitiveness during both bull and bear phases.
Further reading on blockchain standards is available at ethereum.org and regulatory perspectives at sec.gov.
Tools and Platforms for Effective Onchain RWA Analysis
Several established platforms facilitate comprehensive onchain research. Dune Analytics enables custom SQL queries over blockchain data, while specialized RWA dashboards aggregate protocol-specific metrics. Combining these with wallet labeling services improves accuracy when identifying institutional versus retail flows. Regular use of these tools supports proactive rather than reactive investment decisions.
Common Pitfalls in RWA Tokenomics Assessments
Many analysts overlook the distinction between locked supply and truly illiquid tokens. Another frequent error involves ignoring cross-chain bridges that can alter effective supply. Always validate data sources and account for oracle dependencies in asset pricing. Failing to consider governance token mechanics alongside the primary RWA token can also lead to incomplete evaluations.
Conclusion
Comprehensive onchain analysis equips stakeholders with actionable insights into RWA tokenomics. By focusing on supply dynamics, liquidity, holder behaviors, vesting, concentration, and fees, investors can make informed decisions in the evolving 2026 landscape. Continuous monitoring and cross-verification remain essential for navigating this rapidly developing sector.
FAQ
What is the most important onchain metric for RWA projects?
Token velocity combined with collateralization ratios provides the clearest picture of sustainability.
How often should analysts refresh onchain data?
Daily snapshots for active protocols and weekly reviews for slower-moving assets help maintain accuracy.
Can vesting schedules be fully verified onchain?
Yes, when projects deploy transparent vesting contracts with public timestamps and release logic.
Are fee structures standardized across RWA protocols?
No, significant variation exists, making direct comparisons essential before allocation decisions.
What role do bridges play in supply analysis?
Bridges can temporarily shift effective circulating supply across chains, requiring careful tracking to avoid miscalculating true token availability.


No comments yet. Be the first!