 CryptoChain Blog

Introduction to Onchain Analytics in Gaming Tokenomics
Blockchain gaming continues to evolve rapidly in 2026, with play-to-earn models relying heavily on well-designed tokenomics. Onchain analytics provide transparent insights into token flows, helping developers and investors identify sustainable designs versus those prone to collapse. By examining player wallet behaviors, token velocity, and reward distribution, analysts can uncover hidden patterns that traditional metrics miss. This data-driven approach has become essential as gaming ecosystems scale, incorporating millions of daily transactions across multiple blockchains.
The core value of onchain analytics lies in their ability to deliver real-time visibility into economic health. Unlike off-chain reports that may rely on estimates, onchain data captures every transfer, mint, and burn event immutably. This transparency supports better decision-making for both game studios refining their economies and investors evaluating long-term viability. In 2026, leading titles integrate analytics directly into their dashboards, allowing players and stakeholders to monitor key indicators without third-party intermediaries.
Core Metrics for Assessing Token Circulation Health
Healthy tokenomics in gaming ecosystems depend on balanced circulation. Key indicators include token velocity, which measures how often a token changes hands within a defined period, and active wallet distribution across player tiers. Low velocity often signals strong holding incentives such as staking rewards or governance rights, while high velocity can indicate speculative trading that destabilizes in-game economies through rapid sell-offs.
Analysts also track reward distribution patterns to ensure rewards reach a broad player base rather than concentrating among early adopters or bots. Tools like onchain dashboards allow real-time monitoring of these metrics across multiple chains, revealing trends such as the percentage of tokens held by the top 1% of wallets. Another vital metric is the ratio of unique active wallets to total transactions, which helps distinguish organic player engagement from artificial inflation caused by sybil attacks.
Practical Steps for Measuring Velocity
- Extract transaction volume data from the game’s primary smart contracts over a 30-day window.
- Calculate average token turnover by dividing total transfers by the circulating supply.
- Compare results against historical benchmarks from similar titles to identify anomalies.
- Correlate velocity spikes with in-game events like new season launches or token airdrops.
Identifying Sustainable Game Token Design Principles
Sustainable token design requires clear sinks that remove tokens from circulation, such as upgrades, cosmetic purchases, or entry fees, balanced against sources like quest rewards and loot drops. Step-by-step analysis begins with mapping all token issuance events onchain, followed by correlating them with player engagement data from leaderboards and activity logs. For instance, reviewing transaction logs from leading titles reveals whether daily active users correlate positively with token burns during high-engagement periods.
This process helps flag designs where sources outpace sinks, leading to inflation that erodes token value. Developers should model multiple scenarios using historical data to test how proposed changes affect long-term equilibrium. In practice, successful ecosystems maintain a sink-to-source ratio above 1.2 during steady-state operations, ensuring gradual scarcity that rewards dedicated players.
Detecting Whale Activity in NFT Marketplaces
Whale movements can dramatically impact NFT valuations and related token prices in gaming ecosystems. Onchain analytics track large wallet transfers and concentration ratios to spot potential manipulation. Monitoring clustering of high-value NFT trades helps distinguish organic growth from coordinated selling pressure. Analysts often use clustering algorithms on wallet addresses to identify groups operating in tandem, such as shared funding sources or synchronized listing patterns on marketplaces.
Practical evaluation involves setting automated alerts for wallets holding over a threshold percentage of key assets and reviewing their historical activity patterns for signs of accumulation or distribution phases. This vigilance protects smaller players from sudden market shocks caused by large holders exiting positions.
Comparing Token Sinks Versus Sources with Real-World Examples
Effective analysis compares sinks like crafting costs or tournament entries against sources such as staking yields or battle rewards. In titles built on Ethereum and layer-2 networks, analysts review smart contract events to quantify net token creation or destruction over weekly periods. Case studies from established play-to-earn projects demonstrate how adjusting sink strength improved long-term retention by 40 percent or more in recent seasons.
Developers can replicate this success by auditing their own contracts for unintended issuance loopholes, such as overly generous referral programs. Comparing multiple games side-by-side also highlights best practices, such as implementing dynamic pricing for sinks that scale with player population growth.
Data Visualization Techniques for Clearer Insights
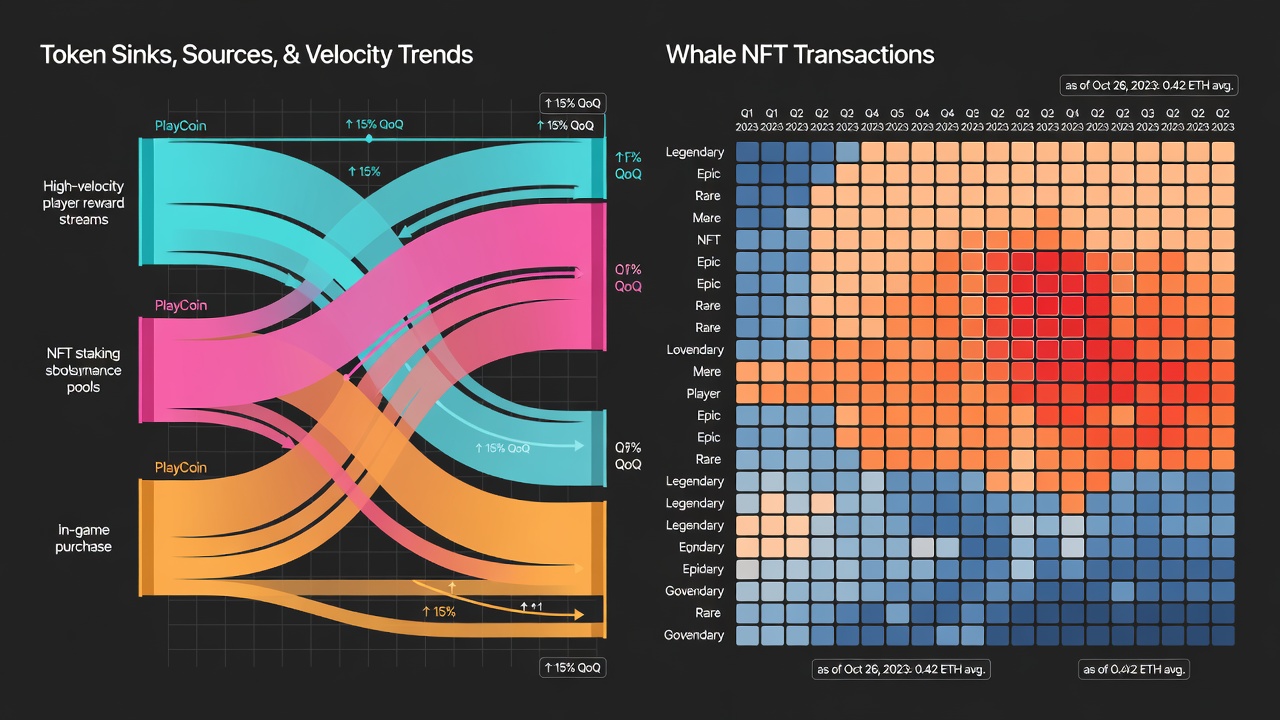
Visual tools transform raw onchain data into actionable charts and graphs. Sankey diagrams illustrate token flows between different wallet categories, while heatmaps highlight peak activity times across time zones. Combining these with velocity trend lines provides a comprehensive view of ecosystem health that static tables cannot match.
Best practices include layering multiple metrics on single interactive dashboards and exporting visualizations for stakeholder reports. This makes complex patterns accessible to non-technical team members and supports faster iteration on economic parameters. Color coding by wallet size further enhances readability when presenting findings to investors.
Recommended Tools and Platforms for Onchain Analysis
Several established platforms support deep gaming tokenomics research in 2026. Analysts frequently combine onchain explorers with specialized dashboards that aggregate data from multiple chains. These tools enable custom queries for metrics like holder distribution and transaction frequency without requiring advanced coding skills.
Integration with game-specific APIs further enriches analysis by blending onchain figures with off-chain behavioral data. Regular updates to these platforms ensure compatibility with new blockchain upgrades and emerging layer-2 solutions popular in gaming.
Common Pitfalls in Gaming Tokenomics Evaluation
- Overlooking off-chain influences such as social media hype that temporarily skew wallet activity and create false signals of adoption.
- Ignoring cross-chain bridging effects that alter apparent circulation metrics by moving tokens outside the primary tracked environment.
- Focusing solely on price action rather than fundamental onchain flows, which can lead to misjudging the durability of economic models.
- Failing to account for seasonal player behavior changes during major game updates or holiday periods that temporarily boost engagement.
- Neglecting bot detection when analyzing active wallets, resulting in inflated engagement numbers that do not reflect genuine human participation.
Conclusion
Onchain analytics empower better decision-making for blockchain gaming tokenomics in 2026. By systematically reviewing wallet behaviors, velocity, sinks, and sources, stakeholders can build more resilient play-to-earn economies. Continuous monitoring remains essential as ecosystems mature and new mechanics emerge. For further reading on blockchain fundamentals, visit Ethereum.org and Bitcoin.org.

No comments yet. Be the first!