 CryptoChain Blog
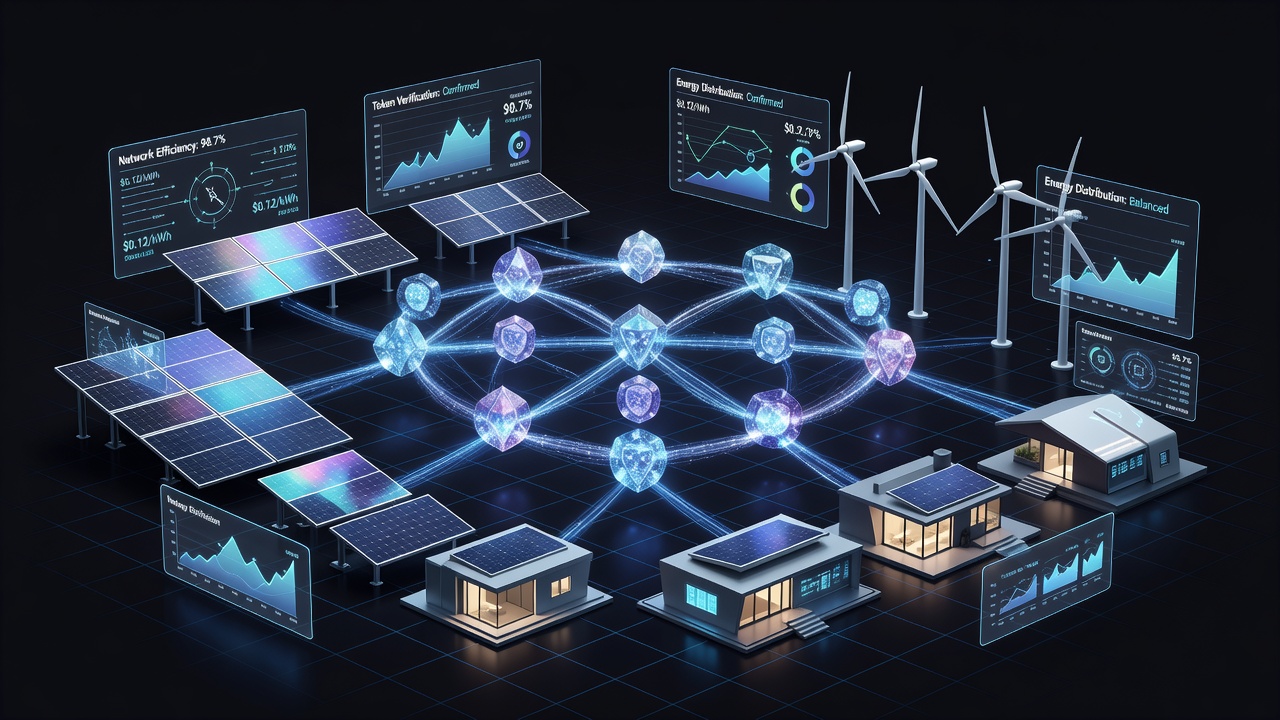
Decentralized energy networks are reshaping global power systems by merging blockchain technology with renewable energy sources such as solar, wind, and battery storage. In 2026, tokenomics models for these networks depend on transparent onchain data to align incentives, track energy flows, and foster long-term economic viability that extends well beyond conventional DeFi yield farming. Advanced practitioners now demand rigorous frameworks that combine blockchain analytics with real-world energy production metrics to identify truly sustainable projects.
Understanding Tokenomics in Decentralized Energy Networks
Tokenomics in decentralized energy contexts encompasses the design of native tokens that represent units of energy, governance voting power, or collateral for network security. These tokens enable peer-to-peer energy trading where producers mint tokens by feeding excess power into the grid and consumers redeem them for actual kilowatt-hours through automated smart contracts. The economic model must balance token issuance with physical energy availability to prevent inflation or deflation that could destabilize participation. Onchain data reveals supply schedules, holder distributions, and transaction patterns that centralized energy markets have historically obscured. For example, a well-designed model might adjust token minting rates based on oracle-fed data from smart meters, ensuring emissions match seasonal renewable output variations.
Practitioners also evaluate how governance tokens empower stakers to propose changes to trading fees or oracle integrations. This layer of onchain decision-making creates feedback loops where successful energy projects see increased token demand driven by actual grid usage rather than speculation alone.
Key Onchain Metrics for Energy Token Analysis
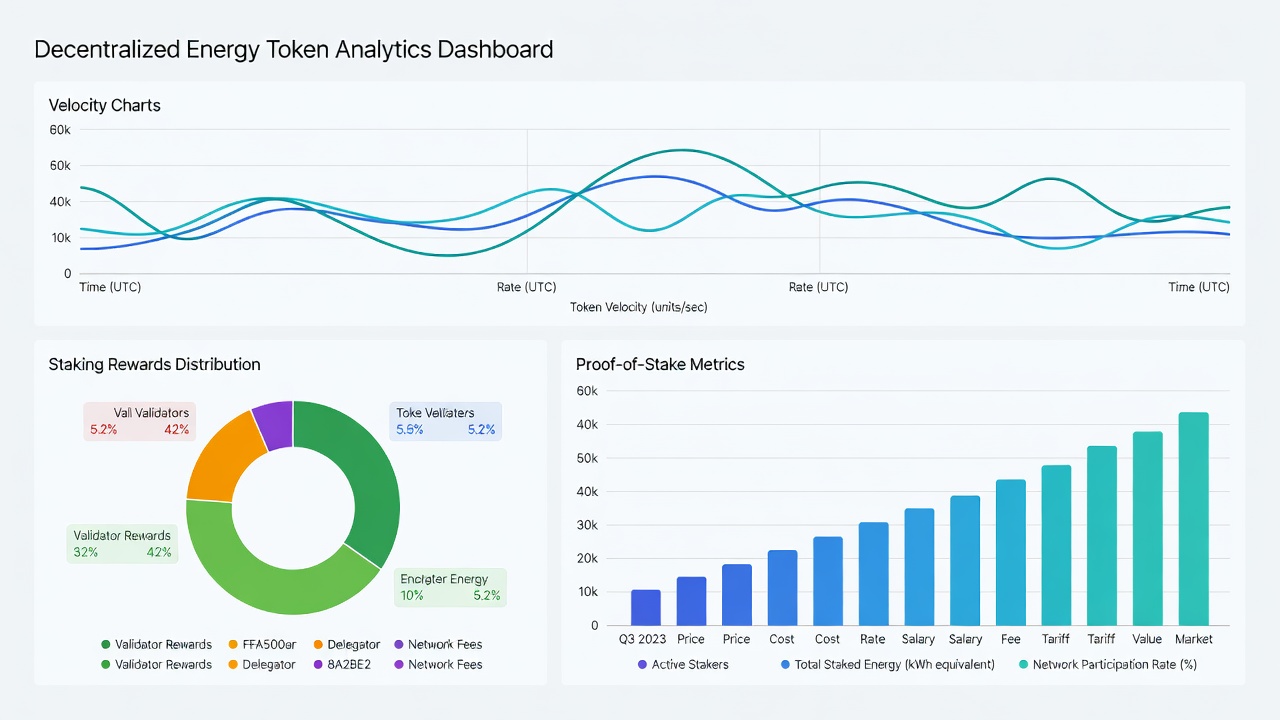
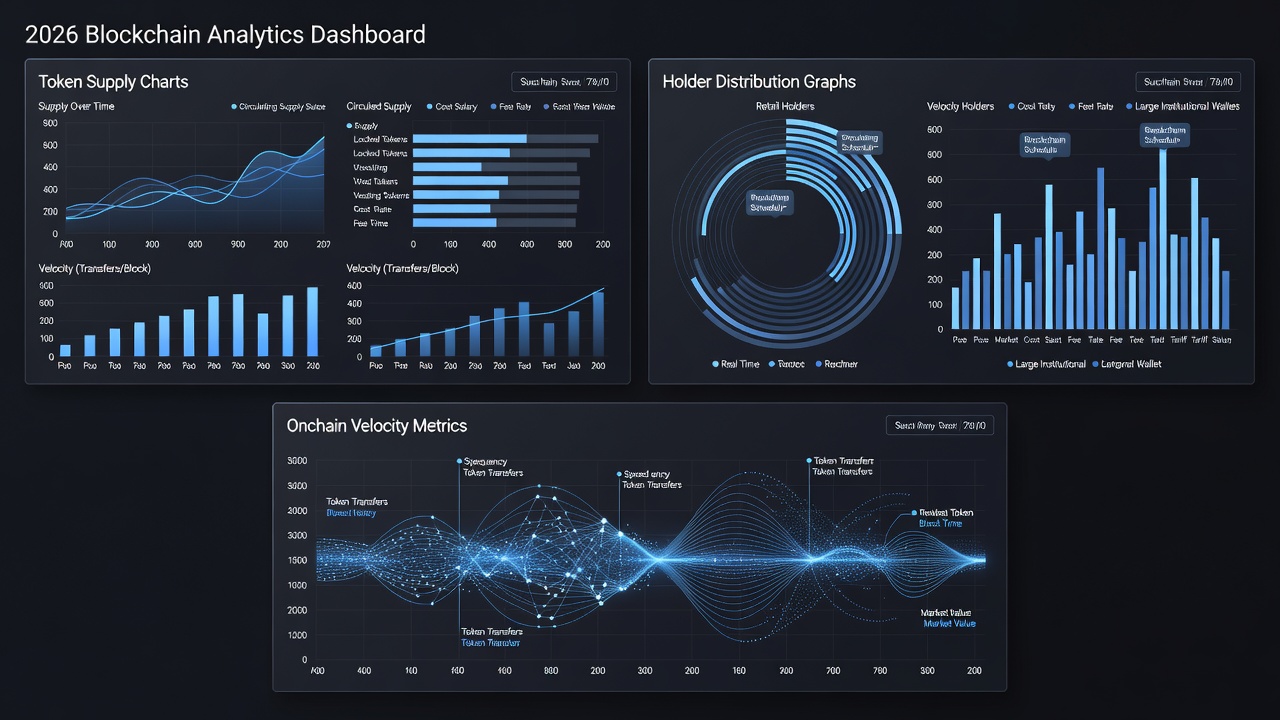
Analyzing energy project tokens requires mastery of several core metrics available through public blockchain explorers and specialized dashboards. Token velocity quantifies the rate at which tokens circulate relative to total supply, serving as an indicator of whether the asset primarily facilitates energy trades or remains locked in speculative positions. Staking incentives determine participation levels by offering rewards for locking tokens to secure the network or validate energy delivery claims. Reward distribution mechanisms allocate newly minted tokens across producers, validators, and liquidity providers, and imbalances here can lead to early adopter dominance.
- Token velocity: Derived from onchain transaction volume divided by circulating supply, typically reviewed over 30-day or 90-day windows to spot usage trends.
- Staking ratio: The percentage of total supply currently committed in staking contracts, directly correlating with network security and participant confidence.
- Reward distribution: Detailed breakdown of emissions shown in smart contract event logs, highlighting shares allocated to different roles.
- Energy-to-token conversion rates: Real-time figures from decentralized oracles that link verified kWh production to token minting events.
- Holder concentration: Gini coefficient or top-holder percentage calculated from wallet distribution data to assess centralization risks.
Monitoring these metrics together provides a multidimensional view that single-point analyses miss.
Step-by-Step Framework for Analyzing Energy Project Token Flows
Advanced users follow a repeatable six-step process to evaluate any decentralized energy token project. First, map the token supply schedule against projected renewable generation using historical onchain oracle records. Second, compute token velocity across multiple timeframes to distinguish between trading activity and holding behavior. Third, audit staking contract parameters including lock-up durations, slashing conditions, and reward multipliers that adjust based on grid stability contributions. Fourth, examine reward distribution smart contracts for equitable allocation across producer categories and validator nodes. Fifth, cross-reference live dashboard visualizations from platforms such as Dune Analytics against comparable projects to identify outliers. Sixth, stress-test the entire model by replaying historical transaction logs under simulated high-demand or low-generation scenarios. Each step incorporates both quantitative onchain queries and qualitative assessment of alignment with physical energy constraints. This framework helps practitioners avoid projects where token incentives decouple from actual renewable output.
Real-World Onchain Dashboards and Examples
Public dashboards published by leading decentralized energy projects display live token flows, staking pools, and energy trade settlements. These interfaces often integrate oracle data feeds showing how many tokens are minted per verified megawatt-hour. One prominent example involves a European microgrid where solar producers stake tokens to unlock dynamic pricing during evening peaks, with every transaction and reward distribution recorded immutably. Another case study from an Asian pilot demonstrates variable staking rewards that increase when participants contribute battery storage capacity, resulting in measurable improvements in grid stability visible through onchain metrics. Comparing these dashboards reveals differences in proof-of-stake implementations, such as fixed versus dynamic emission schedules. Practitioners can replicate similar analysis by querying public blockchain data for wallet activity patterns and reward claim events.
Comparisons Between Proof-of-Stake Energy Tokens
Proof-of-stake variants in energy networks diverge significantly in slashing mechanics and delegation models. Some implementations penalize validators directly for energy delivery shortfalls detected by oracles, while others apply penalties solely based on token consensus failures. Delegation features also vary, with certain projects allowing token holders to assign stakes to specialized energy validators who demonstrate consistent production records. These design choices affect long-term sustainability because models tightly coupled to physical performance tend to attract participants focused on grid reliability rather than pure financial yield. Cross-project benchmarking further considers governance structures that let stakers vote on protocol parameters affecting trading fees and oracle update frequencies. Sustainable strategies favor designs where token value accrual stems primarily from increased energy throughput volume.
Challenges and Risks in 2026 Tokenomics Models
Despite their promise, decentralized energy tokenomics face several onchain and off-chain challenges. Oracle failures or data manipulation can distort energy-to-token conversion rates, leading to over- or under-issuance. Regulatory uncertainty around treating energy tokens as commodities or securities creates compliance risks for cross-border grids. Additionally, high token velocity during speculative periods may mask underlying low real-world usage. Practitioners mitigate these risks by diversifying across multiple oracle providers and maintaining conservative staking thresholds that account for seasonal energy variability.
Best Practices for Sustainable Tokenomics Strategies
To build resilient strategies, practitioners should prioritize projects with transparent onchain reporting of both token metrics and energy production data. Regular audits of smart contract reward logic help prevent unintended centralization. Combining onchain analysis with off-chain verification of renewable asset ownership further strengthens due diligence. Finally, ongoing monitoring of governance proposals ensures that protocol changes continue to support genuine energy transition outcomes rather than short-term token price pumps.
Conclusion
Mastering the tokenomics of decentralized energy networks in 2026 demands comprehensive onchain analysis of velocity, staking incentives, and reward flows. By applying the detailed framework and studying live dashboards, advanced practitioners can distinguish robust projects from those relying on unsustainable incentives. This approach moves beyond traditional DeFi patterns to support measurable progress in renewable energy adoption. For additional context, refer to authoritative resources from the International Energy Agency, the Ethereum Foundation, and the National Renewable Energy Laboratory.

No comments yet. Be the first!