 CryptoChain Blog

Introduction to Oracle Tokenomics in 2026
Oracle networks form the backbone of decentralized data feeds powering DeFi, NFTs, and cross-chain applications. In 2026, evaluating their token economics requires deep onchain analysis to assess long-term resilience. This breakdown examines how leading protocols sustain value through staking dynamics, fee accrual, and provider incentives while leveraging blockchain analytics tools for token velocity tracking and distribution heatmaps. As DeFi integrations expand rapidly across multiple chains, understanding these metrics helps forecast which oracle tokens will maintain utility and demand. Onchain data reveals real-time health indicators that traditional financial analysis often misses, allowing participants to make informed decisions about participation and investment.
The growing complexity of decentralized finance means oracles must handle increasing volumes of data requests while maintaining economic security. Tokenomics models that fail to adapt risk losing node operators and data providers to more attractive networks. This article provides a comprehensive framework for analysis using publicly available blockchain data.
Core Components of Oracle Network Economics
Oracle systems rely on decentralized nodes to deliver accurate external data to smart contracts. Their tokenomics revolve around balancing supply incentives with network security. Key elements include staking requirements that lock tokens to deter malicious behavior and fee structures that distribute revenue to data providers. Successful networks create flywheel effects where increased usage boosts token demand through burns or staking rewards. Onchain dashboards track these flows to identify sustainable models versus those vulnerable to dilution from excessive emissions.
Additional components involve governance tokens that allow holders to vote on parameter changes such as reward rates and slashing conditions. These mechanisms ensure the network evolves with market needs while preserving economic alignment between users, providers, and token holders.
Staking Dynamics and Data Provider Incentives
Staking serves as the primary security mechanism. Participants lock tokens to operate nodes or delegate to trusted operators. In return, they earn shares of protocol fees and penalties for poor performance. Incentives must align with uptime and accuracy to prevent centralization risks that could compromise data integrity. Leading protocols adjust reward rates dynamically based on total staked supply. Analytics platforms allow users to monitor staking concentration and delegation patterns over time, revealing potential risks from whale dominance or sudden unstaking events.
Real-world examples show that networks with tiered staking models often achieve better distribution. For instance, operators with higher stakes receive proportionally larger shares of fees but face stricter performance requirements. This setup encourages professional node management while allowing smaller participants to delegate and still benefit from rewards.
Fee Accrual Mechanisms Explained
Fees generated from data requests flow back to token holders via staking pools or treasury distributions. This accrual model rewards active participation while funding network operations. Onchain queries can break down fee sources by use case, such as price feeds versus verifiable random functions used in gaming and lotteries. Transparent fee tracking helps evaluate whether revenue scales with adoption. Protocols that implement automated burns from fees create deflationary pressure that supports token value during high-usage periods.
Understanding the split between operational costs and net rewards to stakers is crucial. Some networks allocate a portion of fees to insurance funds that cover potential data errors, adding another layer of economic resilience that onchain metrics can verify through treasury wallet activity.
Tracking Token Velocity with Onchain Tools
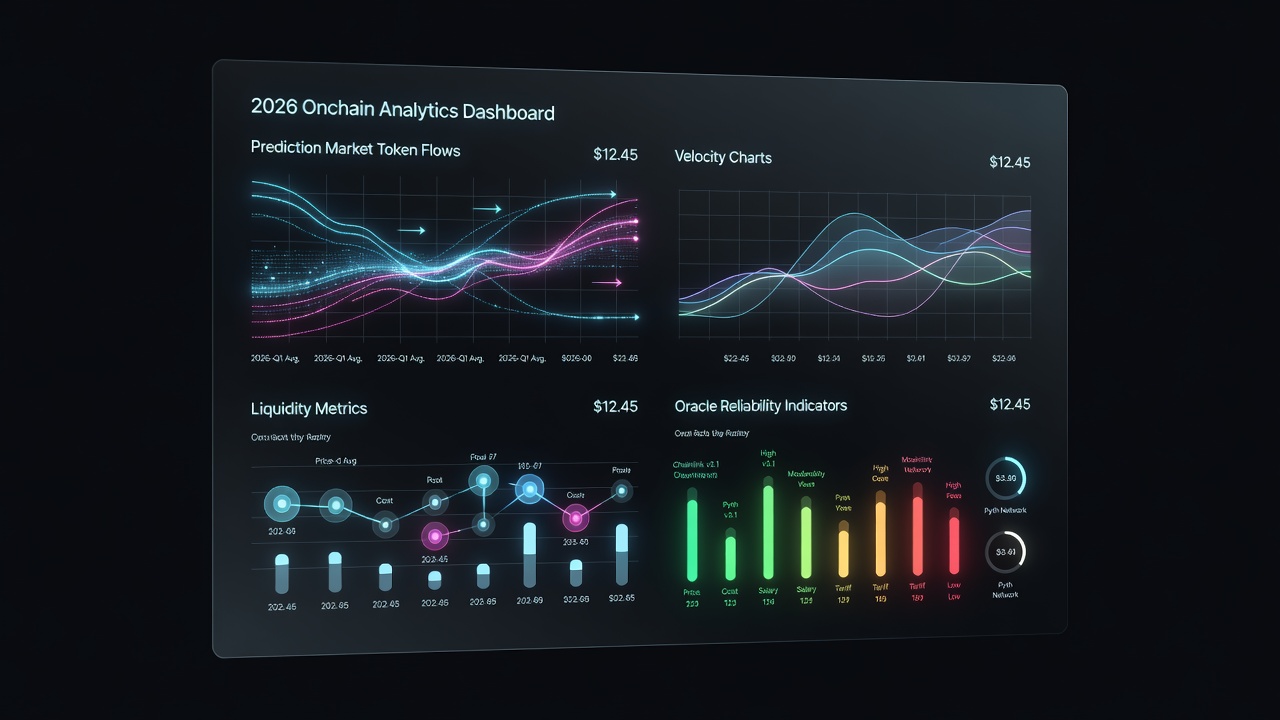
Token velocity measures how frequently tokens circulate within the ecosystem. High velocity can indicate strong utility but may pressure price if not matched by demand growth. Analysts use transaction volume data and active address metrics to calculate velocity ratios. Step-by-step workflow begins with querying token transfer events on a blockchain explorer. Next, aggregate daily volumes against circulating supply. Finally, correlate spikes with protocol usage events like major DeFi liquidations or new integration announcements. Extending this analysis over multiple quarters reveals seasonal patterns and long-term trends in token circulation.
Advanced users can layer velocity data with gas usage statistics to see how network congestion affects oracle operations and subsequent token movements. This layered approach provides deeper insight than velocity alone.
Distribution Heatmaps and Holder Analysis
Distribution heatmaps visualize token concentration across wallets, exchanges, and smart contracts. These visuals highlight risks from large holders or liquidity pools. Healthy networks show broad distribution with significant portions locked in staking contracts. Tools like Dune Analytics enable creation of custom heatmaps by plotting holder percentiles over months. Comparing snapshots reveals migration trends that signal growing or waning confidence among different holder cohorts.
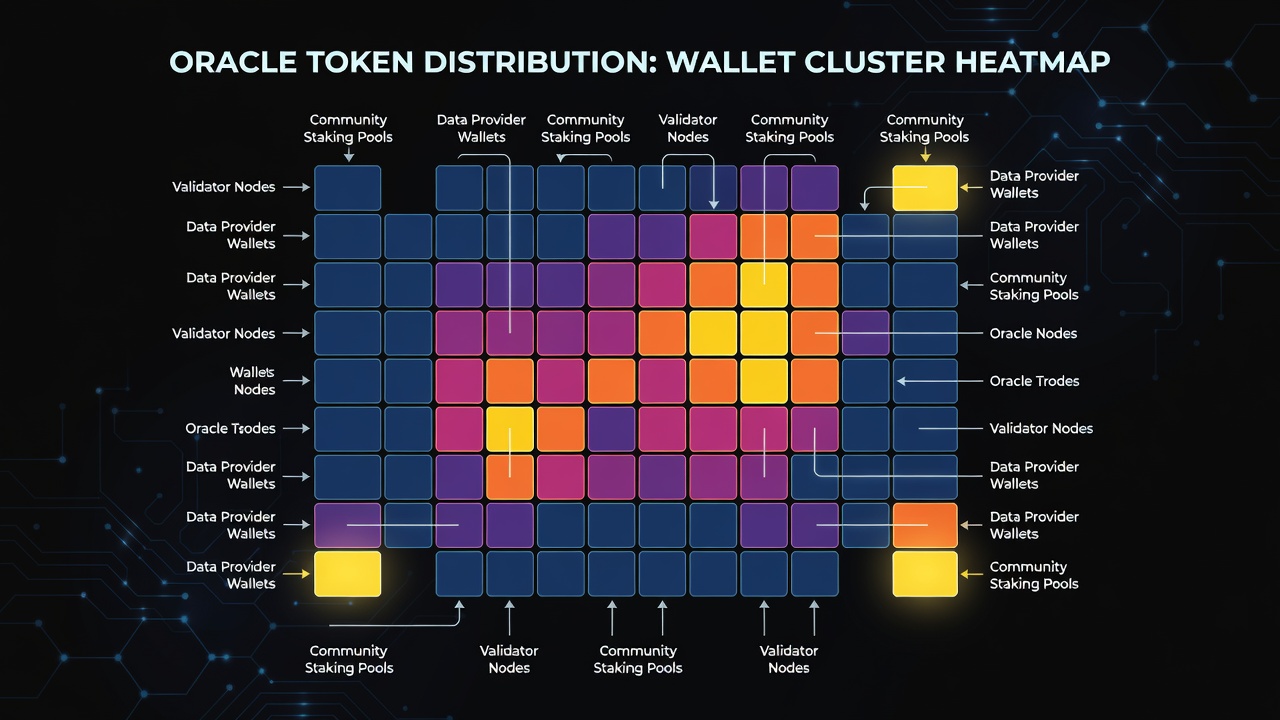
Heatmaps also help identify exchange inflows that may precede selling pressure. By filtering for smart contract addresses specifically tied to staking or vesting schedules, analysts can isolate locked supply and better estimate liquid float available for trading.
Real-World Protocol Examples
Chainlink exemplifies robust tokenomics through its LINK token, which secures the largest oracle network via staking and node operations. Chainlink demonstrates how fee accrual from premium data feeds supports ongoing incentives. Other networks like Band Protocol and API3 offer contrasting models worth comparing via onchain metrics. Examining Ethereum-based oracles shows how base-layer upgrades influence oracle performance and token flows. Ethereum.org resources provide context on gas dynamics affecting oracle costs. Additional examples from emerging multi-chain oracles highlight how cross-chain bridging impacts token distribution and velocity patterns.
Comparison Table of Oracle Token Health Indicators
| Indicator | Chainlink | Band Protocol | API3 |
|---|---|---|---|
| Staking Ratio | High concentration in nodes | Moderate delegation | Community-focused pools |
| Fee Accrual | Direct to stakers | Treasury allocation | Buyback mechanism |
| Velocity Trend | Stable with usage growth | Variable by chain | Low due to locking |
| Distribution | Broad institutional | Exchange-heavy | DAO-controlled |
| Governance Activity | Active proposals | Periodic votes | High community input |
Step-by-Step Analysis Workflows
- Connect to a blockchain analytics platform and select the oracle token contract address.
- Build queries for staking contract interactions to assess lock-up periods and reward claims.
- Generate velocity calculations using 30-day moving averages of transfers.
- Export data to visualize heatmaps showing top-100 holder changes.
- Cross-reference with DeFi protocol integrations to predict demand shifts.
- Monitor treasury wallet outflows for signs of operational spending versus token emissions.
Using Advanced Analytics Tools
Platforms such as Dune provide pre-built dashboards for oracle-specific queries that can be customized further. Users can set alerts for unusual staking withdrawals or sudden changes in active node counts. Combining these tools with onchain labeling services helps distinguish between exchange wallets and long-term holders for more accurate distribution analysis.
Common Pitfalls and FAQ
What is the biggest mistake when evaluating oracle tokens?
Ignoring off-chain governance decisions that can override onchain metrics, leading to sudden incentive changes.
How often should analysts review distribution heatmaps?
Weekly reviews during volatile periods help catch early signs of concentration risks before they impact token resilience.
Can token velocity alone predict sustainability?
No, velocity must be paired with fee revenue data and staking participation rates for accurate forecasting.
Why do some oracle tokens underperform despite high usage?
Overly generous emissions or poor fee distribution mechanisms can erode value even when data demand remains strong.
How do multi-chain deployments affect tokenomics tracking?
They require aggregating data across several networks, which complicates velocity calculations and holder concentration views.
Forecasting Oracle Token Resilience Amid DeFi Growth
With expanding DeFi integrations, oracles that maintain balanced tokenomics are positioned to capture more value. Onchain analysis serves as an early warning system for detecting shifts in staking participation or fee generation. Practitioners should regularly update their dashboards to incorporate new protocol features and chain expansions.
Conclusion
Onchain analysis equips investors and developers with actionable insights into oracle tokenomics. By mastering staking dynamics, fee structures, velocity, and distribution patterns, stakeholders can better navigate the evolving landscape of decentralized data networks in 2026 and beyond.

No comments yet. Be the first!