 CryptoChain Blog
Introduction to Prediction Market Tokenomics in 2026
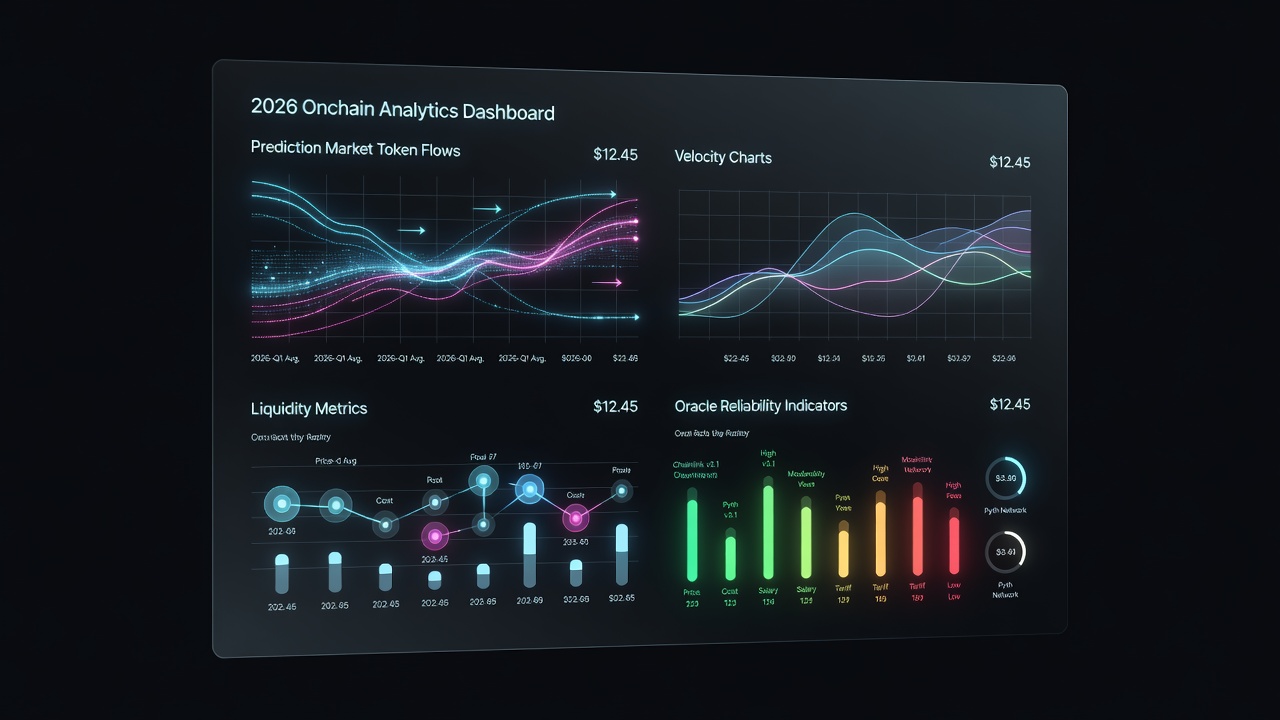
Prediction markets have evolved into sophisticated DeFi ecosystems where tokenomics determine long-term viability. In 2026, onchain analytics provide the clearest lens for evaluating whether protocols align incentives sustainably or lean toward extractive models. Analysts now rely on blockchain data to dissect trading volume velocity, liquidity provider rewards, and resolution mechanisms without depending solely on off-chain narratives.
This guide equips intermediate analysts with actionable frameworks for interpreting these signals. By examining real protocol behaviors through transparent ledger activity, readers can distinguish protocols built for endurance from those optimized for short-term extraction. The focus extends beyond surface-level statistics to include velocity calculations, incentive flow mapping, and oracle dispute pattern recognition that reveal underlying economic health.
Core Onchain Metrics Driving Token Sustainability
Effective analysis begins with velocity metrics that reveal how actively tokens circulate within prediction markets. Trading volume velocity measures the ratio of traded volume to circulating supply over defined periods, highlighting whether tokens facilitate genuine market activity or merely speculative churn. For instance, protocols showing velocity ratios above 5x monthly often indicate robust engagement rather than idle holdings.
Liquidity provider incentives represent another critical layer. Onchain tracking of reward distribution schedules, staking participation rates, and impermanent loss exposure helps quantify whether providers receive fair compensation relative to risk. Protocols that front-load rewards often show declining participation curves visible in historical transaction data. Analysts should monitor the frequency of reward claim transactions and correlate them with liquidity depth changes to detect early signs of provider fatigue.
Resolution oracle reliability completes the triad. Analysts examine historical dispute rates, finality times, and cross-referenced outcomes stored on-chain to assess oracle performance. Reliable oracles reduce resolution friction and support deeper market participation. Key signals include the percentage of markets resolved without disputes and average time from market close to final settlement, both extractable from event logs.
Case Studies of Leading Platforms
Leading prediction market protocols demonstrate varied tokenomic approaches. One established platform maintains consistent liquidity through dynamic fee redistribution visible in repeated reward claim transactions. Its treasury wallet activity shows steady outflows tied directly to trading volume spikes, creating a self-reinforcing cycle of participation.
Another relies on governance token emissions that analysts can track via treasury wallet outflows and staking contract interactions. Cross-referencing these emissions with user retention metrics reveals whether new liquidity arrives or merely existing participants rotate positions. Protocols publishing verifiable onchain treasury reports tend to attract more sophisticated liquidity providers who monitor allocation efficiency over time. A third emerging platform uses hybrid models combining fixed emissions with performance-based bonuses, offering analysts clear onchain fingerprints through separate contract interactions for each reward type.
Comparing Fee Structures Across Protocols
Fee structures directly influence token velocity and holder incentives. Some protocols implement flat trading fees redistributed to stakers, while others use tiered models based on market duration or volume thresholds. Onchain fee accrual data reveals which models generate consistent treasury inflows without deterring traders. For example, flat-fee designs often produce predictable daily collection events that can be aggregated into weekly treasury growth trends.
Analysts should review cumulative fee collection events alongside token burn or redistribution transactions. Protocols that balance fee generation with meaningful holder benefits typically exhibit healthier retention patterns in wallet cohort analysis. When comparing across chains, note that gas costs and bridge fees indirectly affect net returns, making multi-chain fee data essential for accurate benchmarking. For deeper context on decentralized infrastructure supporting these markets, refer to resources from the Ethereum Foundation, Chainlink, and Web3 Foundation.
Building Custom Dashboards to Track Market Maker Behavior
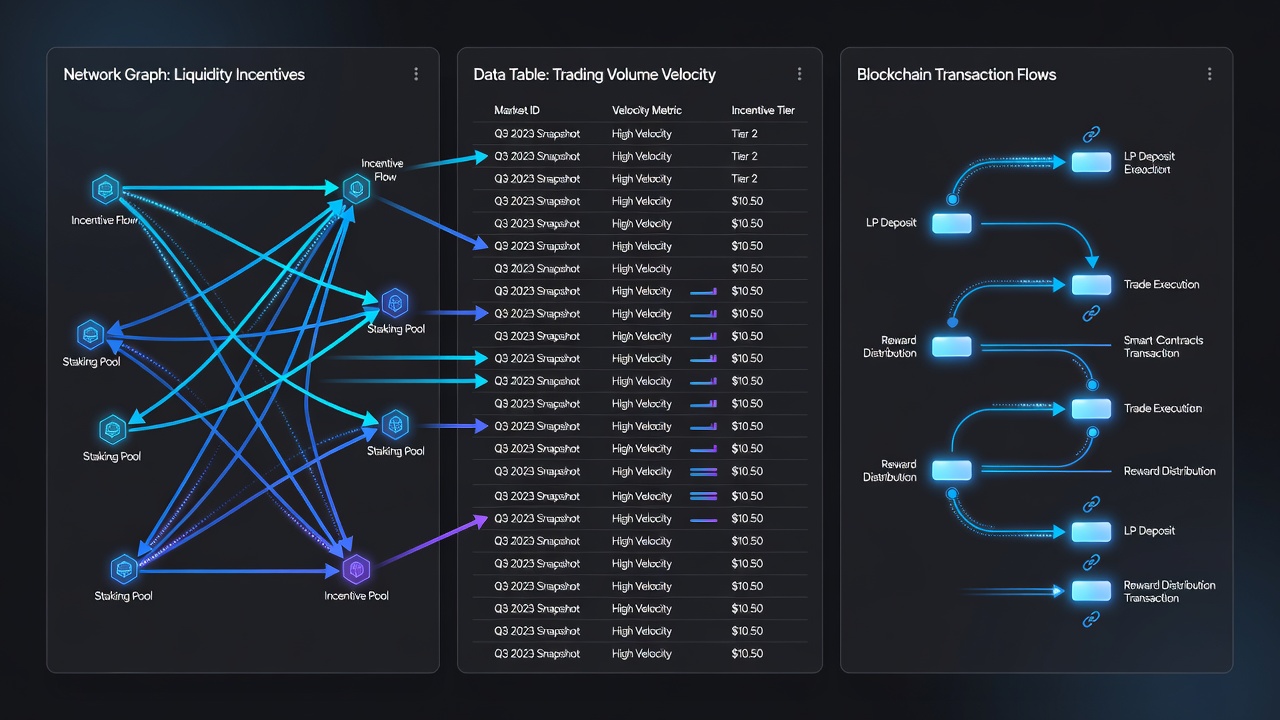
Custom dashboards empower analysts to monitor market maker activity in real time. Start by querying transaction logs from liquidity pools and reward contracts using standard blockchain indexing tools. Key visualizations include time-series plots of liquidity depth versus reward emissions, wallet cohort retention curves segmented by staking duration, oracle dispute frequency heatmaps across different market categories, and velocity ratios calculated from daily volume and active token supply.
Practical implementation involves combining data from multiple chains when protocols deploy across ecosystems. Cross-chain analytics highlight where liquidity migrates in response to incentive changes, offering early signals of shifting tokenomic health. Begin with these steps: identify core contracts via protocol documentation or explorer labels, set up recurring queries for transfer and event logs, normalize timestamps across chains, then layer visualizations that flag anomalies such as sudden reward claim clusters from single wallets. Advanced users can incorporate machine-readable alerts triggered when velocity drops below historical averages for more than three consecutive days.
Identifying Healthy Incentive Alignments Versus Extractive Models
Healthy alignments appear as balanced flows between traders, liquidity providers, and token holders. Onchain evidence includes steady staking participation, proportional reward distribution, and low concentration of governance power among a few wallets. For example, protocols where the top ten holders control less than 25 percent of voting tokens often demonstrate broader community involvement.
Extractive patterns manifest as rapid treasury depletion, front-loaded emissions that coincide with large holder exits, or oracle mechanisms that favor insiders through repeated dispute resolutions. Analysts can flag these by monitoring large token transfers from protocol treasuries and correlating them with governance proposals. Red flags also include reward contracts that repeatedly send tokens to the same small set of addresses shortly after new market launches, suggesting coordinated extraction rather than organic growth.
Common Data Interpretation Challenges
Interpreting onchain data presents several pitfalls. One common issue is conflating raw volume with sustainable activity when wash trading inflates metrics. Analysts mitigate this by filtering transactions from known bot addresses or examining order book depth consistency. Another challenge involves distinguishing between organic staking growth and temporary yield farming spikes that reverse quickly once emissions taper. Cross-referencing staking contract events with external liquidity pool balances helps isolate genuine commitment.
Finally, oracle data can appear reliable until a single high-stakes market triggers unexpected disputes. Maintaining historical dispute logs allows analysts to build predictive models of resolution risk rather than relying on point-in-time snapshots.
Frequently Asked Questions on Data Interpretation
How do I verify if a velocity spike is genuine? Cross-check daily volume against unique wallet counts and average trade size. Sustained increases across multiple wallets usually indicate real activity.
What signals suggest an oracle is becoming less reliable? Rising dispute rates or increasing time between market close and resolution often precede broader confidence erosion.
Can treasury outflows alone prove an extractive model? No. Always correlate outflows with simultaneous changes in liquidity depth and user retention metrics for context.
Which tools best support multi-chain dashboard creation? Standard indexing services combined with visualization platforms allow seamless aggregation of transaction and event data across networks.
Conclusion
Onchain analytics transform prediction market evaluation from narrative-driven assessment into data-backed analysis. By focusing on velocity, incentives, and oracle performance, analysts gain the tools to identify protocols positioned for sustainable growth in 2026 and beyond. Continuous dashboard refinement and cross-protocol comparison remain essential practices for staying ahead of evolving tokenomic dynamics.


No comments yet. Be the first!