 CryptoChain Blog
Introduction to Tokenomics Trends in 2026
As blockchain technology matures, tokenomics—the study of token supply, distribution, utility, and incentives—continues to evolve rapidly. In 2026, analysts are leveraging advanced onchain data to uncover shifts that go far beyond simple metrics like total supply or market cap. This guide provides beginner-friendly yet actionable insights into emerging trends, helping readers interpret real-time blockchain analytics for informed decision-making. The focus remains on practical application, enabling anyone to start analyzing protocols using freely available tools and public datasets.
Understanding these dynamics is essential for investors, developers, and enthusiasts alike. Onchain analysis reveals how tokens behave in live ecosystems, offering transparency that traditional finance cannot match. By examining wallet flows, staking participation, and governance activity directly from the blockchain, readers gain a clearer picture of sustainability and potential risks. This approach moves past headline numbers to reveal underlying economic health in major networks.
Dynamic Supply Mechanisms: A Core 2026 Shift
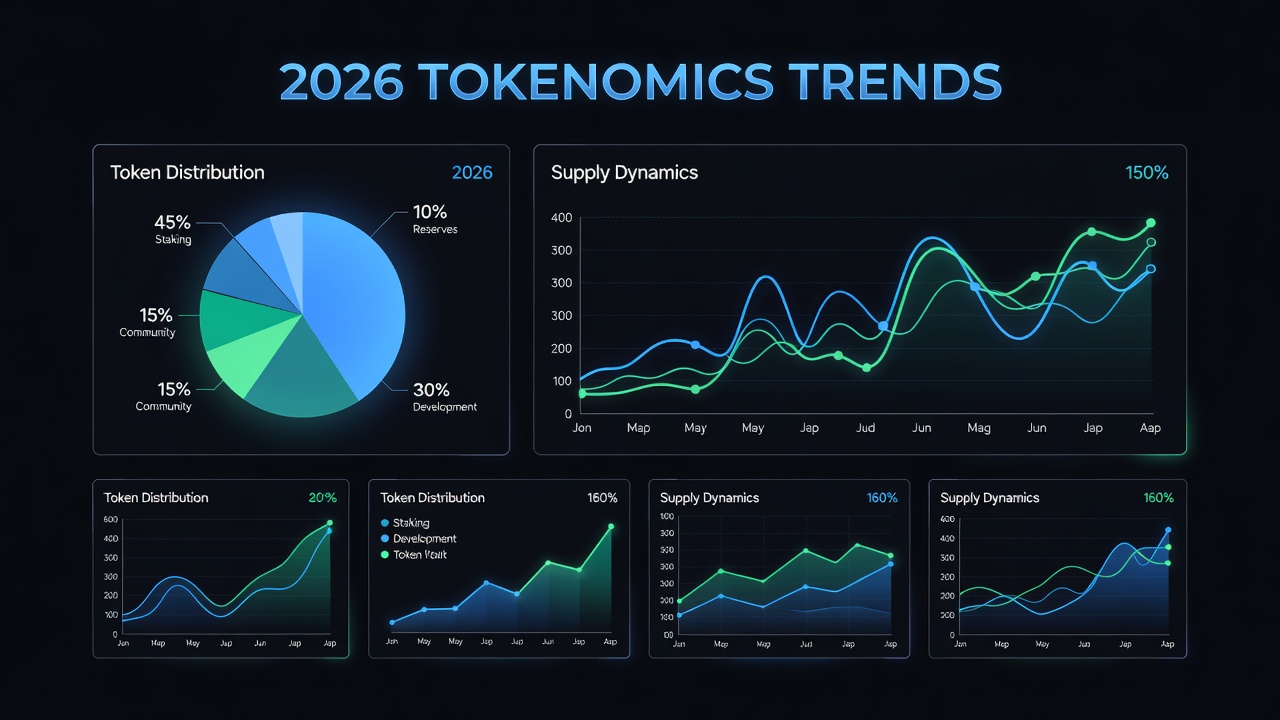
Traditional fixed-supply models are giving way to dynamic mechanisms that adjust based on network activity, staking participation, or governance votes. These adaptive systems aim to balance inflation with utility, responding to real usage patterns detected through onchain metrics such as transaction volume and wallet activity. For instance, some protocols now feature elastic supplies that expand or contract automatically when certain thresholds in daily active addresses or total value locked are crossed.
Analysts monitor these via public dashboards to predict supply changes before they impact price. The benefit lies in greater responsiveness to market conditions, reducing the likelihood of extreme inflation or deflation scenarios that plagued earlier token designs. Readers can track these adjustments by observing changes in circulating supply over rolling 30-day periods on explorers.
Evolving Governance Models
Governance tokens are incorporating more sophisticated voting structures, including quadratic voting and delegation with performance-based rewards. These models reduce centralization risks while encouraging broader participation. Onchain analysis helps track proposal success rates and voter turnout, providing insights into community health. Hybrid approaches that combine onchain execution with offchain signaling have become common, allowing faster iteration while maintaining transparency.
Real-world examples include major DeFi protocols where governance has shifted toward these hybrid models. Participation metrics often show higher engagement when rewards are tied directly to proposal outcomes visible in transaction histories.
Key Onchain Metrics to Track for Tokenomics
To build a solid foundation, focus on these core metrics that reveal token health:
- Holder concentration: Measure the percentage of supply held by the top 10 or 100 addresses.
- Active address growth: Track daily unique wallets interacting with the token contract.
- Staking ratios: Calculate the portion of supply locked in staking contracts versus liquid supply.
- Velocity of tokens: Observe how frequently tokens change hands over time.
- Governance participation: Review vote counts and quorum achievement on recent proposals.
These indicators together paint a comprehensive view when analyzed over multiple months.
Practical Steps for Interpreting Distribution Data
Interpreting token distribution requires systematic onchain analysis. Follow these actionable steps using free public tools:
- Access a blockchain explorer or analytics platform to pull wallet concentration data and export CSV files for further review.
- Calculate metrics like the Gini coefficient for distribution fairness by segmenting holder addresses into quartiles and comparing balances.
- Track large transfers over time to identify potential sell pressure from early investors or treasuries, setting alerts for movements above 1% of total supply.
- Cross-reference with vesting contract data to forecast unlocks by examining smart contract code for release schedules.
- Validate findings across at least two independent data sources to account for any labeling discrepancies in exchange wallets.
These techniques allow immediate application without paid subscriptions and scale from simple observations to deeper custom queries.
Real-World Examples from Major Protocols
Protocols like Ethereum demonstrate how staking dynamics influence effective supply. Ethereum Foundation resources highlight ongoing upgrades that refine token flows through improved consensus mechanisms. Similarly, Solana-based projects showcase high-throughput environments where onchain velocity metrics reveal usage trends distinct from slower chains. Solana documentation provides transparent views into network activity that analysts can cross-reference with token distribution.
Comparisons across ecosystems show how Layer-1 versus Layer-2 solutions handle token incentives differently, with onchain data exposing efficiency gaps in fee distribution and liquidity provision. Additional examples from established DeFi platforms illustrate how treasury management affects long-term holder confidence.
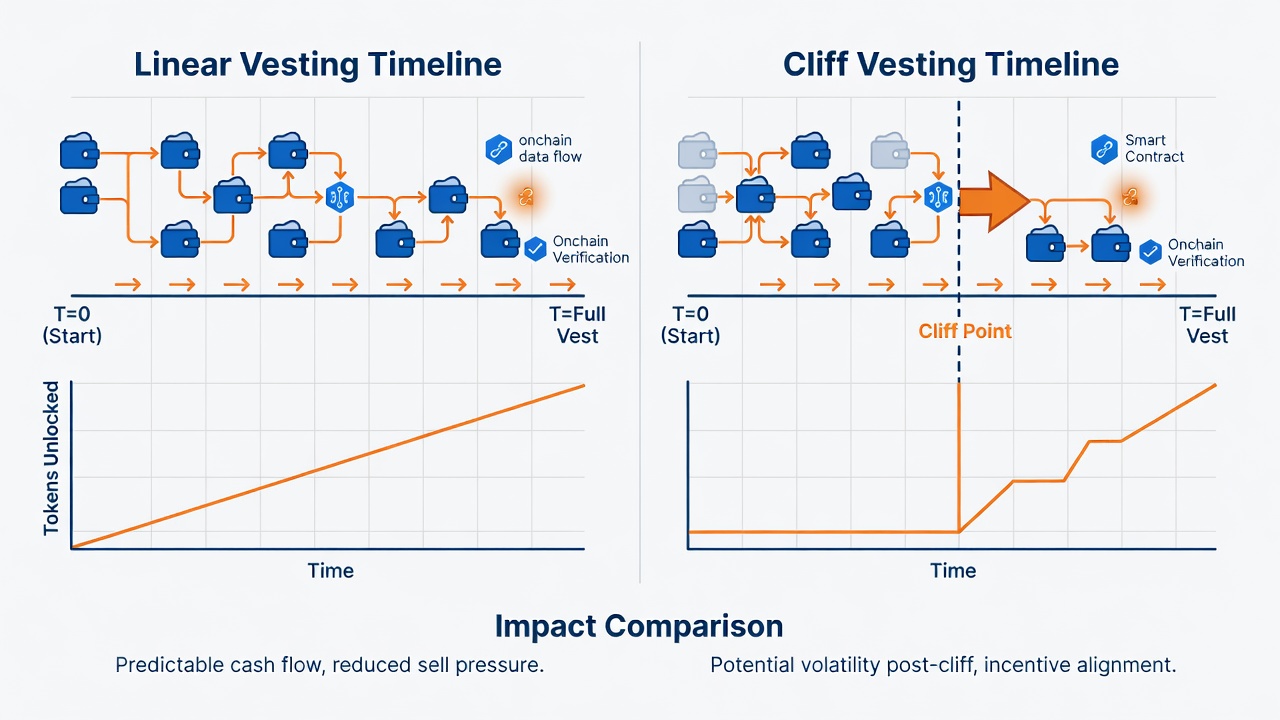
Comparing Vesting Impacts
Vesting schedules significantly affect long-term token stability. Linear vesting spreads unlocks evenly, reducing dump risks, while cliff-based models create concentrated events visible in onchain flows. Analysts compare impacts by simulating unlock scenarios against historical data. For instance, protocols with 12-month cliffs often see higher volatility post-unlock compared to those using monthly releases over 36 months.
Examining actual transfer patterns after past unlocks provides empirical evidence of how different schedules influence market behavior. This comparison helps readers evaluate new projects by reviewing their vesting contract parameters directly on the blockchain.
Common Pitfalls and How to Avoid Them
Many newcomers overlook nuances such as exchange-controlled wallets that distort concentration metrics or fail to account for bridged assets across multiple chains. Always verify wallet labels through multiple explorers and consider multi-chain data aggregation. Another frequent mistake is ignoring smart contract upgrades that can alter token mechanics mid-stream; reviewing upgrade histories on block explorers mitigates this risk.
Actionable Techniques with Public Analytics Tools
Tools like Dune allow users to query live data for custom tokenomics dashboards. Start by building simple queries for holder distribution, then layer in governance vote analytics. Regular monitoring of these metrics helps spot emerging trends early, such as rising whale accumulation or shifts in staking ratios. Dune Analytics offers community-shared templates that beginners can fork and customize immediately.
Combine multiple data sources for a holistic view—transaction graphs, smart contract interactions, and liquidity pool depths all contribute to deeper understanding. Setting up recurring reports on key protocols ensures consistent tracking without daily manual effort.
Frequently Asked Questions
What is the most important onchain metric for tokenomics analysis?
Holder distribution and active addresses often provide the clearest signals of healthy token economics, revealing concentration risks and genuine usage.
How do dynamic supply mechanisms differ from fixed supplies?
Dynamic models adjust minting or burning based on onchain triggers like demand signals, offering more flexibility than static caps.
Can beginners use these techniques without coding skills?
Yes, many platforms offer no-code interfaces with pre-built templates for distribution and vesting analysis.
Why focus on 2026 specifically?
Recent protocol upgrades and maturing analytics tools have accelerated the adoption of sophisticated token models visible in current onchain datasets.
How often should distribution data be reviewed?
Weekly checks are sufficient for most tokens, with deeper monthly reviews when major unlocks or governance votes are scheduled.
Conclusion
Mastering 2026 tokenomics trends through blockchain analytics empowers readers to move beyond surface-level observations. By applying the practical steps, metric frameworks, and comparisons outlined here, anyone can start extracting valuable insights today using accessible public tools. Consistent application of these methods supports better evaluation of protocol sustainability over time. Stay engaged with evolving data to navigate the dynamic crypto landscape effectively.
No comments yet. Be the first!