 CryptoChain Blog

Advanced Onchain Techniques for Token Economics Optimization 2026
In 2026, token economics optimization has evolved far beyond basic supply and demand curves into a discipline that leverages live blockchain data streams for continuous refinement. Intermediate and advanced builders now rely on sophisticated onchain techniques to diagnose weaknesses in their economic models and implement targeted improvements. This comprehensive guide examines practical methods for velocity analysis, holder distribution modeling, and incentive mechanism testing, complete with workflows, code patterns, and comparisons that help teams build more resilient token systems.
Why Onchain Analytics Matter for Token Design
Traditional economic modeling often depends on static assumptions derived from historical data or user surveys conducted off-chain. While these methods provide useful directional guidance, they frequently miss the granular, real-time behaviors that define successful token economies. Onchain analytics deliver immediate visibility into transaction patterns, capital movements, and participant responses, allowing protocols to adjust parameters such as reward rates or fee structures with precision. Teams that integrate these signals can identify emerging issues like rising velocity or increasing concentration before they become systemic problems. The shift toward onchain methods also supports greater transparency, as governance participants can review the same live datasets used by core contributors.
Velocity Analysis Techniques
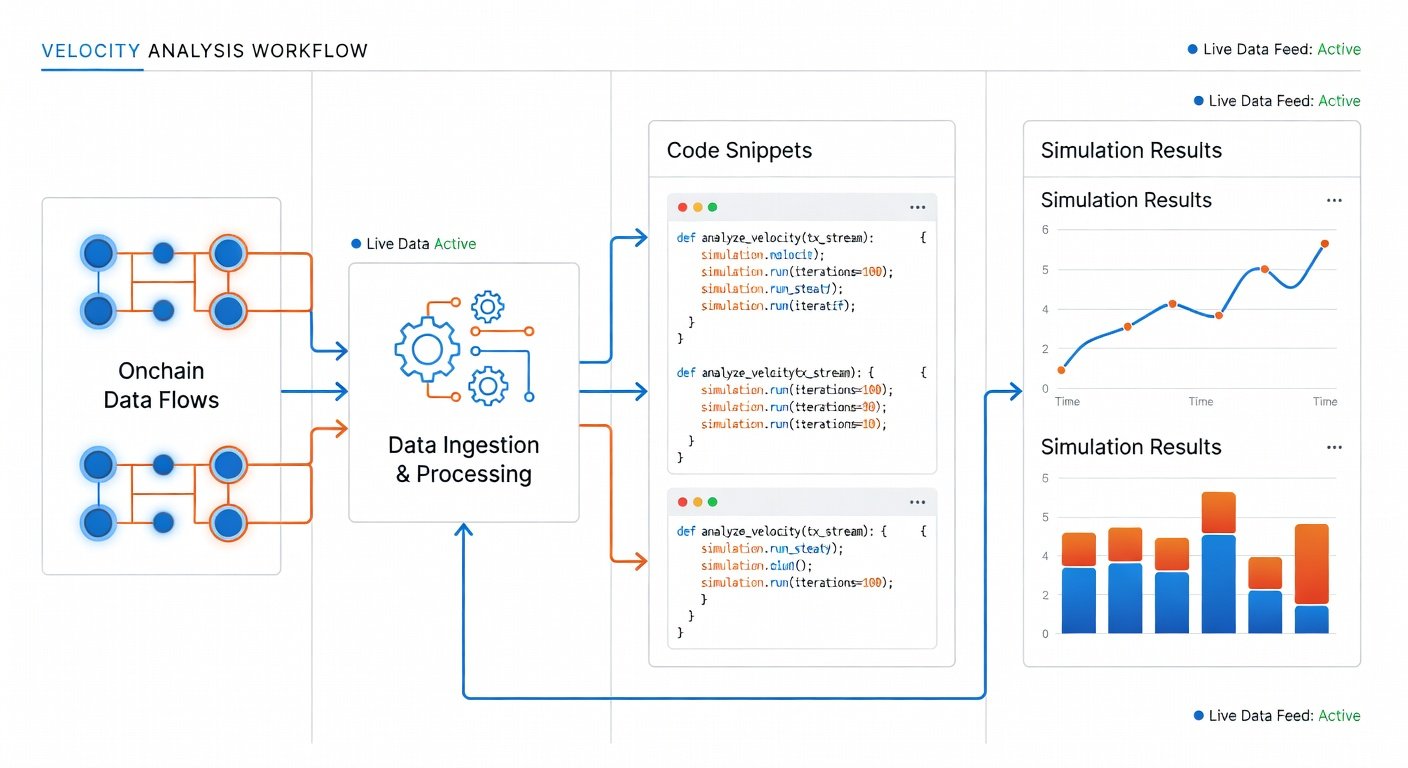
Token velocity quantifies how quickly units circulate within an ecosystem. Elevated velocity typically indicates insufficient holding incentives and can pressure token value over time. In 2026, advanced practitioners combine onchain transaction graphs with time-weighted volume metrics to project velocity under hypothetical policy changes. The process begins by extracting all relevant transfer events from indexed blockchain data. Analysts then compute median holding durations across different user cohorts and run forward simulations that incorporate proposed staking modifications or burn mechanisms. For example, a protocol might discover that its current reward distribution leads to rapid cycling of tokens among liquidity providers. By adjusting the lock-up period in a test environment, the team can observe a measurable decline in simulated velocity before submitting changes to governance.
Additional techniques include cohort-based decay modeling, where historical holding periods inform predictive curves, and cross-protocol comparisons that benchmark velocity against similar projects. These methods require careful handling of edge cases such as bridged assets or wrapped tokens that may distort raw calculations. When executed correctly, velocity analysis becomes a proactive tool rather than a reactive report.
Ethereum Foundation resources offer foundational patterns for logging transfer metadata that support accurate velocity computations across multiple networks.
Holder Distribution Modeling
Balanced holder distribution reduces single-point risks and strengthens long-term network health. Onchain modeling employs concentration ratios, Lorenz curves, and retention analysis drawn directly from balance snapshots taken at regular intervals. Practitioners track the share of supply controlled by the largest addresses and simulate redistribution outcomes following proposed vesting schedules or community distributions. Gini coefficients calculated from onchain balances provide a standardized measure of inequality that can be tracked over time and compared across protocols.
Practical Steps for Distribution Analysis
- Query current and historical balances using reliable indexed providers that cover both layer-1 and layer-2 environments.
- Segment addresses into meaningful cohorts based on acquisition channel, such as liquidity mining versus private sales, and calculate average holding times for each group.
- Apply Monte Carlo simulations to forecast how distribution metrics evolve after implementing new incentive programs or token burns.
- Document assumptions and results in governance proposals so community members can evaluate the projected impact.
- Monitor post-implementation metrics to validate model accuracy and refine future forecasts.
These steps create a repeatable framework that teams can automate through scheduled queries and alerting systems.
Incentive Mechanism Testing with Code Examples
Validating incentive designs requires controlled environments that closely mirror mainnet conditions. Developers deploy mirrored contracts on testnets and feed them historical transaction traces to observe behavioral responses. Adjustable parameters such as reward multipliers or penalty functions can be tuned iteratively while logging participation and retention data.
The following Solidity example illustrates a basic staking tester contract that exposes rate adjustments and emits events for downstream analytics:
contract IncentiveTester {
    mapping(address => uint256) public stakes;
    uint256 public rewardRate;
    event StakeUpdated(address indexed user, uint256 amount, uint256 newRate);
    function adjustRate(uint256 newRate) external {
        rewardRate = newRate;
        emit StakeUpdated(msg.sender, stakes[msg.sender], newRate);
    }
    function stake(uint256 amount) external {
        stakes[msg.sender] += amount;
    }
}
Teams extend such contracts with additional logic for time-weighted rewards and slashing conditions. After running multiple scenarios, they export results to visualization tools that highlight which parameter sets produce the most stable participation curves.
Solidity documentation provides detailed guidance on event logging and state management patterns essential for these testing frameworks.
Integrating Multiple Data Sources: Step-by-Step Workflow
Comprehensive optimization demands the fusion of onchain telemetry with complementary off-chain signals. A robust 2026 workflow follows these expanded stages:
- Index raw events from primary chains and connected layer-2 networks using decentralized indexing services.
- Enrich datasets with developer activity metrics from public repositories and sentiment indicators derived from governance forums.
- Construct unified dashboards that surface leading indicators several days ahead of observable onchain movements.
- Implement automated alert systems that notify contributors when predefined thresholds for velocity or concentration are crossed.
- Conduct periodic audits of data pipelines to ensure completeness and minimize latency introduced by cross-chain bridges.
By layering these sources, teams reduce blind spots that single-metric approaches commonly overlook.
Onchain vs Traditional Economic Modeling
Traditional models remain valuable for high-level strategic planning and regulatory scenario analysis. However, they lack the temporal resolution and behavioral fidelity that onchain data supplies. Onchain techniques deliver rapid feedback at the expense of greater technical complexity and the need for ongoing infrastructure maintenance. Successful teams adopt hybrid frameworks in which traditional models establish broad targets while onchain analytics supply continuous calibration and validation. This combination yields superior capital efficiency and stronger community alignment compared with either method used in isolation.
Practical Workflows and Case Studies
Consider a decentralized lending protocol that observed increasing token velocity after launching a new rewards program. By applying the velocity analysis techniques described earlier, the team identified that short-term liquidity providers were cycling rewards immediately. They responded by introducing tiered lock-up options tested first in a sandbox environment. Post-implementation data showed a 30 percent reduction in velocity within the first month while maintaining overall participation levels. Similar approaches have been documented across multiple DeFi projects, demonstrating the repeatable value of these methods.
Tools and Risk Management for 2026 Implementation
Modern toolkits include modular analytics platforms supporting both custom queries and visual builders. Risk management practices emphasize scenario planning for black-swan events such as sudden liquidity drains or regulatory shifts. Teams maintain version-controlled models and conduct regular tabletop exercises that simulate extreme distribution changes. These preparations help ensure that optimization efforts remain robust under stress.
Frequently Asked Questions
How often should velocity be recalculated?
Leading protocols refresh velocity metrics every four to six hours during periods of active governance to capture rapid behavioral shifts while avoiding unnecessary noise from intraday fluctuations.
What data sources are most reliable for holder distribution?
Indexed blockchain archives paired with verified contract event logs deliver the highest accuracy, reducing dependence on any single centralized provider.
Can these techniques be applied to layer-2 networks?
Yes, the same analytical patterns transfer directly to rollups, provided teams adjust for sequencer latency and withdrawal queue dynamics in their simulations.
How do teams handle cross-chain asset flows in velocity models?
Analysts apply normalization factors that account for bridge delays and wrapped token mechanics, ensuring that velocity figures reflect genuine economic activity rather than technical artifacts.
What governance considerations arise when publishing onchain model results?
Clear documentation of assumptions, data sources, and uncertainty ranges helps community members interpret findings and participate meaningfully in proposal discussions.
Conclusion
Advanced onchain techniques equip token teams with precise instruments for refining economic parameters in real time. Through disciplined application of velocity analysis, distribution modeling, incentive testing, and multi-source data integration, projects can construct token economies that adapt effectively to changing conditions throughout 2026 and beyond. Continuous learning and iterative improvement remain essential as the ecosystem continues to mature.


No comments yet. Be the first!