 CryptoChain Blog

Introduction to Token Economics and Onchain Analysis
Token economics, commonly referred to as tokenomics, studies the economic design of a cryptocurrency including its supply schedule, distribution methods, utility within its ecosystem, and incentive structures that influence long-term value. In 2026, newcomers to the space can explore these fundamentals using onchain data, which consists of publicly recorded transactions and smart contract interactions visible directly on blockchains such as Ethereum, Solana, and others. Unlike offchain information from centralized exchanges or social media, onchain metrics offer verifiable transparency that anyone can inspect without permission.
This beginner’s guide focuses on approachable methods to analyze real-time data through free dashboards. Readers will gain practical skills for examining supply mechanics, observing holder behavior patterns, interpreting wallet distributions, tracking liquidity movements, and identifying potential warning signs. The content emphasizes step-by-step processes suitable for users without programming experience, helping them build confidence when evaluating mid-cap tokens and understanding broader market dynamics.
Core Concepts: Supply Mechanics and Holder Behavior
Supply mechanics form the foundation of token economics by defining how many tokens exist, how new ones are created or burned, and what schedules govern releases. Fixed-supply models create scarcity through a hard cap, while inflationary designs release additional tokens via staking rewards or mining. Onchain inspection of smart contracts reveals actual mint functions and emission rates, allowing verification beyond project whitepapers. Holder behavior complements this by showing how tokens flow between addresses over time. Accumulation by long-term holders may indicate strong conviction, whereas frequent transfers to exchanges could signal upcoming selling pressure. Monitoring these movements helps reveal community health and potential shifts in market sentiment.
Understanding the interplay between supply and behavior provides context for why certain tokens maintain stability while others experience volatility. Beginners benefit from starting with simple queries on public explorers before progressing to more complex visualizations.
Interpreting Wallet Distributions with Free Dashboards
Wallet distribution analysis examines the concentration of tokens across addresses to assess decentralization levels. High concentration in a small number of wallets raises centralization concerns, while even spread across thousands of holders often correlates with greater resilience. Free tools simplify this process. Begin by locating the token’s contract address on a reputable aggregator site, then paste it into an explorer like Etherscan to access the holders tab. Review percentages held by the top ten or twenty addresses and note whether they belong to exchanges, team-controlled wallets, or unknown entities.
Step-by-step walkthrough: First copy the contract address from a data platform. Next navigate to the explorer homepage and search for the token. Switch to the token holders section and sort by balance size. Cross-check recent transactions for each top wallet to detect patterns such as repeated outflows. Finally compare distribution snapshots from different dates to observe changes. Repeating this exercise across several tokens builds intuition for healthy versus risky profiles. Additional platforms like Dune Analytics offer pre-built visualizations that display distribution charts without requiring users to write queries.
Tracking Liquidity Flows and Market Depth
Liquidity represents the ease with which tokens can be traded without causing drastic price changes. It flows primarily through decentralized exchange pools where users provide assets in pairs. Monitoring inflows and outflows helps gauge market depth and potential slippage risks. Platforms such as DefiLlama display total value locked across protocols and daily trading volumes, revealing whether liquidity is growing steadily or experiencing sudden drains.
Observe transfers between liquidity pools and external wallets to spot unusual activity. Consistent additions from multiple small providers typically support organic growth, while large single withdrawals may precede volatility. Combining liquidity data with volume trends offers a clearer picture of sustainable trading conditions. Beginners should track these metrics weekly to establish baseline expectations for different token sizes.
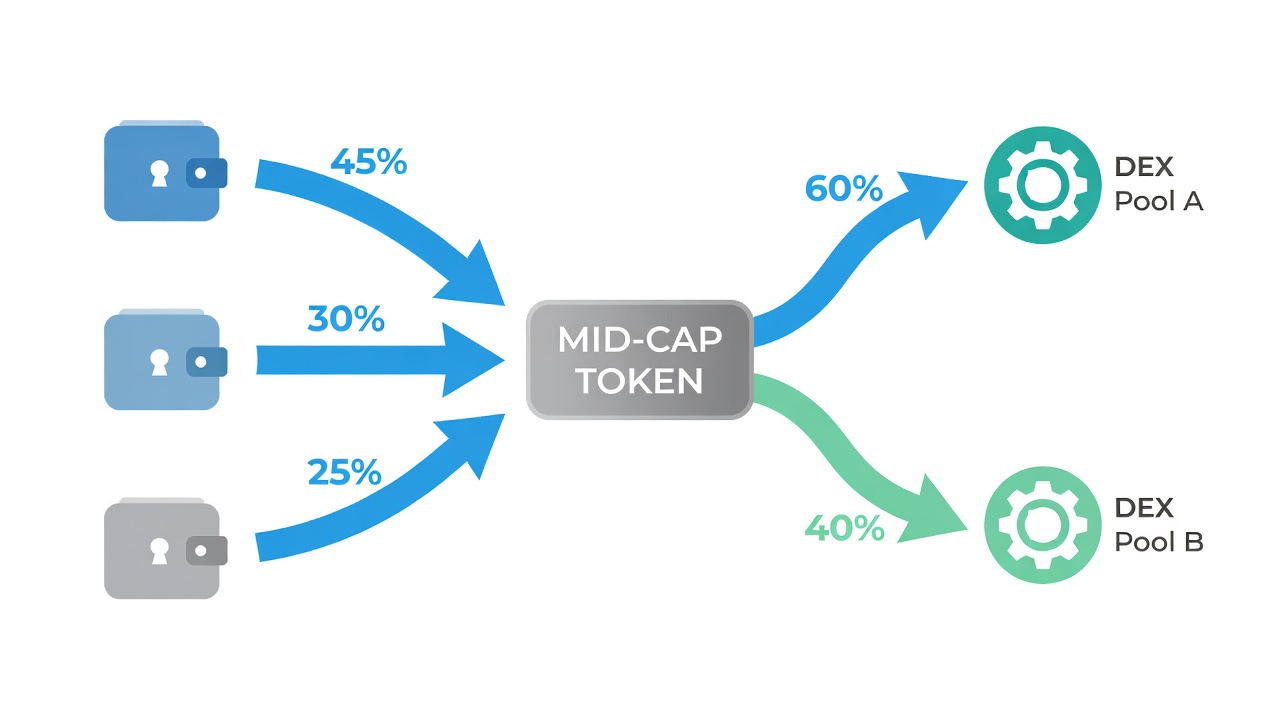
Practical Example: Analyzing a Mid-Cap Token
To illustrate these methods, consider a detailed walkthrough for a hypothetical mid-cap token with a total supply capped at 500 million units and a current circulating supply near 320 million. Using public dashboards, the top ten wallets control approximately 45 percent of the supply, including two addresses associated with the project team that have remained inactive for over sixty days. Liquidity pools across major decentralized exchanges hold roughly eight million dollars in paired assets, while average daily trading volume hovers around two million dollars. Further examination shows a gradual increase in unique active addresses over the past thirty days, with many smaller wallets accumulating modest positions rather than large speculative bets.
Additional checks include reviewing transaction histories for any scheduled unlocks or burns visible onchain. The combination of moderate concentration, stable liquidity, and rising address activity suggests balanced token economics with manageable risks. Users repeating this analysis on live tokens should document findings in a notebook or spreadsheet, noting dates and key observations to track evolution. This hands-on approach transforms abstract concepts into concrete decision-making skills applicable across multiple projects.
Spotting Early Red Flags Without Coding
Early detection of problematic patterns prevents costly mistakes. Common red flags include extreme concentration where five or fewer wallets hold over half the supply, unscheduled minting events visible in contract transactions, and liquidity pools with persistently low volume below meaningful thresholds. Other signals involve sudden large transfers from team wallets shortly after vesting periods end or a steady decline in daily active addresses over multiple weeks.
- Extreme concentration: More than 50 percent held by five wallets indicates potential control issues.
- Rapid minting events: Unexpected supply increases that contradict stated tokenomics.
- Illiquid pools: Volume remaining under sustainable levels with wide bid-ask spreads.
- Team wallet activity: Coordinated outflows following unlock schedules.
- Declining active addresses: Falling unique interactions signaling waning interest.
Document observations consistently and compare against similar tokens to contextualize findings.
Getting Started with Free Public Tools
Beginners should assemble a simple toolkit consisting of blockchain explorers, analytics dashboards, and aggregators. Start with contract address lookup on Etherscan or equivalent chain-specific sites, then layer in visualization platforms for distribution and flow analysis. Regular practice with one token per week builds familiarity. Cross-referencing multiple sources reduces reliance on any single view and improves accuracy. Over time this routine reveals how token economics evolve in response to market events.
Common Misconceptions: Onchain vs Offchain Data
FAQ
Q: Is onchain data always more accurate than offchain reports?
A: Onchain data provides verifiable transaction records but misses certain off-exchange activities such as over-the-counter trades or internal exchange bookkeeping. Combining both sources yields the most complete picture.
Q: Do I need to learn programming to use onchain tools?
A: No. Most free dashboards feature visual interfaces and pre-built queries designed specifically for non-technical users.
Q: Can onchain analysis predict token prices reliably?
A: It illuminates supply, demand, and distribution dynamics but cannot guarantee future price movements. Treat findings as one input among many research factors.
Q: Are all wallet addresses identifiable in detail?
A: The majority remain pseudonymous. Only addresses labeled by exchanges or known entities offer clearer attribution; others require careful inference.
Q: How often should beginners review onchain metrics?
A: Weekly checks suffice for most users, with more frequent monitoring during periods of high volatility or major project updates.
Conclusion
Developing proficiency in token economics through onchain data equips beginners with actionable insights for 2026 and beyond. By mastering supply verification, wallet analysis, liquidity tracking, and red-flag identification using accessible free tools, readers establish a solid foundation for ongoing research. Consistent practice across varied tokens fosters better judgment and supports informed participation in evolving crypto ecosystems.

No comments yet. Be the first!