 CryptoChain Blog
Introduction to Behavioral Tokenomics in 2026
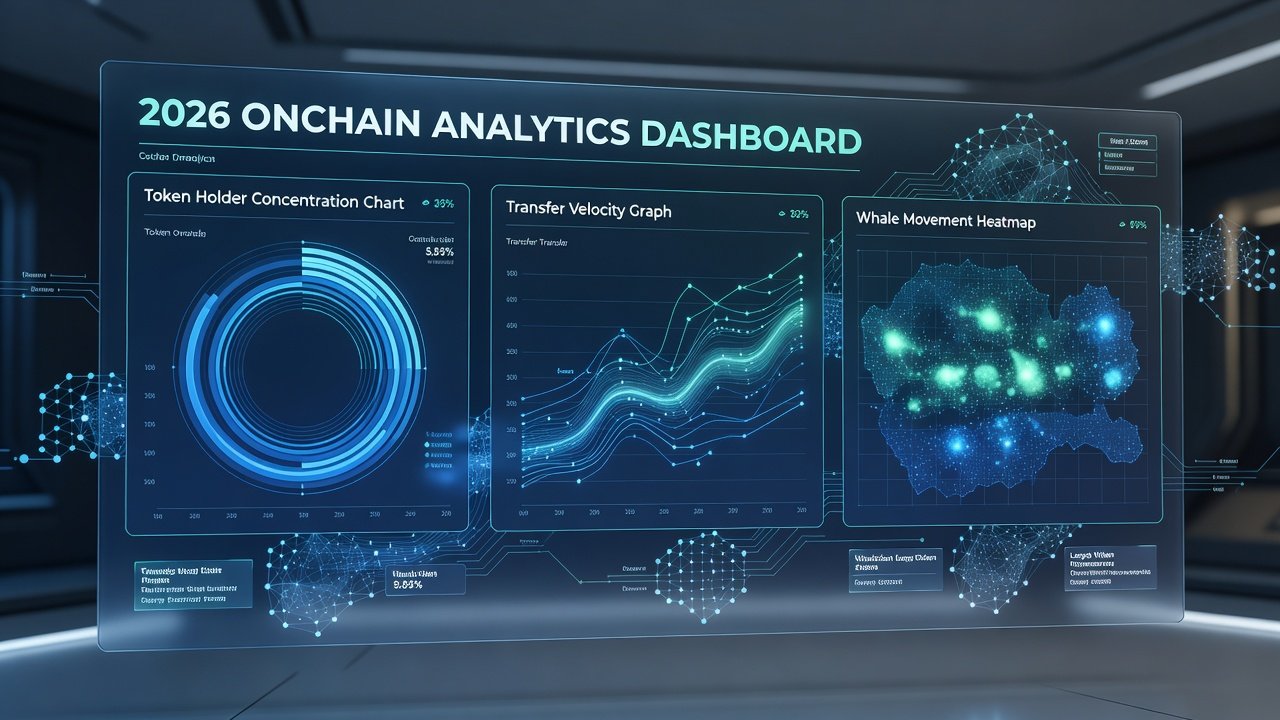
Behavioral tokenomics examines how onchain data reveals the actions of token holders and their effects on overall token economics. In 2026, analysts rely on metrics like wallet concentration ratios, transfer velocity patterns, and holding duration distributions to evaluate retention strength and potential selling pressure. This approach moves beyond simple distribution snapshots to provide actionable insights for sustainable token design across DeFi and infrastructure projects. Token economies thrive when holders exhibit predictable behaviors, but unexpected shifts in whale activity or retail sentiment can quickly erode value. By leveraging advanced onchain tools, analysts gain visibility into these dynamics, enabling proactive adjustments to tokenomics models such as vesting schedules, staking rewards, and governance mechanisms.
Understanding these dynamics helps teams anticipate market shifts. For example, high whale concentration often signals upcoming volatility, while steady retail accumulation indicates growing community support. In practice, projects that ignore behavioral signals face repeated cycles of hype followed by rapid sell-offs, damaging long-term viability.
Key Metrics for Analyzing Holder Behaviors
Wallet concentration ratios measure the percentage of supply held by top addresses. A ratio above 40 percent in the top 10 wallets typically flags elevated centralization risk. Transfer velocity tracks how frequently tokens move between wallets, indicating liquidity or speculation levels. Low velocity often correlates with strong holder conviction, whereas spikes above historical averages point to heightened trading activity. Holding duration distributions show the average time tokens remain in wallets, highlighting long-term conviction versus short-term trading. Analysts segment these distributions into quartiles to identify the proportion of tokens held for over 180 days versus those flipped within 30 days.
These metrics together paint a complete picture of retention and pressure points. Analysts cross-reference them with transaction timestamps to spot patterns like coordinated selling. Additional layers include active address growth rates and exchange inflow volumes, which together help distinguish organic demand from artificial pumps.
Step-by-Step Guide to Tracking Whale Movements
Follow these steps using popular blockchain explorers and analytics platforms:
- Identify top holders via onchain queries on platforms like Etherscan. Export the top 100 addresses and label any known exchange or custodian wallets.
- Monitor large transfers exceeding defined thresholds, such as 1 percent of circulating supply. Set alerts for movements between private wallets and centralized exchanges.
- Analyze destination wallets for exchange deposits or new accumulation addresses. Use clustering techniques to group related wallets controlled by the same entity.
- Correlate movements with price action over 30-day windows to assess impact. Compare against baseline volatility to determine if a transfer triggered measurable price changes.
- Track post-transfer behavior by monitoring subsequent transactions from recipient addresses over the following two weeks.
This process reveals whether whales are distributing or consolidating positions. Repeating the workflow monthly allows teams to build historical baselines and detect deviations early.
Retail Accumulation Trends and Detection Methods
Retail investors typically accumulate in smaller batches. Track metrics such as the number of unique wallets holding under 0.1 percent of supply and rising active address counts. Rising trends here often precede broader adoption phases. Analysts also monitor the ratio of new wallets created versus dormant wallets reactivated, which can signal fresh capital entering the ecosystem.
Compare these against historical cycles to forecast potential support levels during market corrections. For instance, when retail wallet growth accelerates while whale concentration remains stable, it frequently marks the start of sustainable price appreciation. Tools that segment addresses by age and transaction frequency provide granular views of accumulation speed.
Comparisons: DeFi Tokens vs Infrastructure Tokens
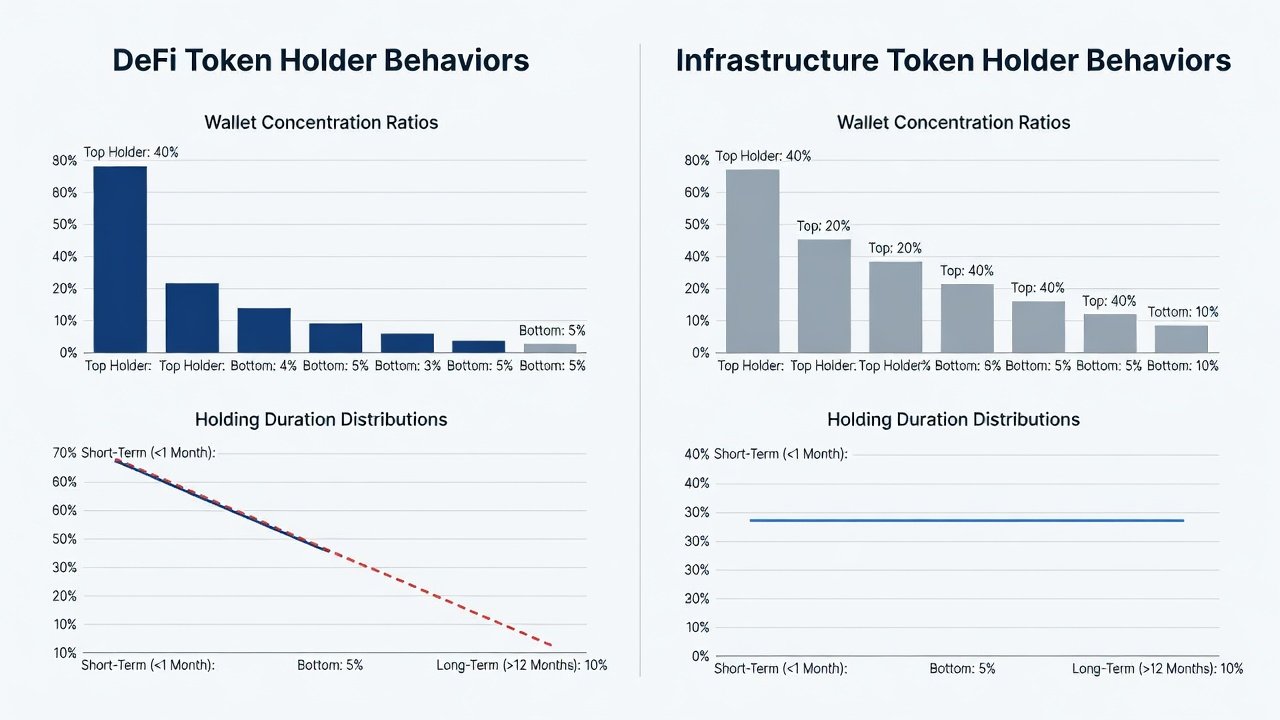
DeFi tokens frequently exhibit higher transfer velocity due to yield farming and trading activity. Infrastructure tokens, by contrast, show longer holding durations as they support real-world utility like data networks or compute resources. DeFi protocols may experience velocity spikes of 300 percent during governance votes or liquidity mining events, while infrastructure assets maintain steadier concentration ratios around 25 to 35 percent in top wallets. Analysts use these differences to tailor token incentives accordingly, such as implementing longer lockups for infrastructure tokens to match their utility-focused holder base.
Cross-protocol comparisons also reveal sector-specific norms. A DeFi token might see 15 percent monthly turnover among retail holders, whereas an infrastructure token often sustains under 5 percent turnover, reflecting deeper integration into operational workflows.
Practical Checklist for Onchain Behavioral Analysis
- Calculate concentration ratios for the top 10 and top 100 wallets monthly and compare against project-specific benchmarks.
- Segment velocity by wallet size to distinguish whale versus retail flows and flag anomalous clusters.
- Review holding duration quartiles for shifts in long-term holder percentages, especially the share held longer than one year.
- Cross-validate findings with off-chain sentiment data where available, including social volume and developer activity metrics.
- Document anomalies such as sudden multi-wallet coordination or unusual bridging activity across chains.
- Establish automated dashboards that refresh key ratios daily and generate alerts when thresholds are breached.
- Include exchange flow analysis to separate custodial movements from organic holder behavior.
Advanced Techniques and Real-World Application Examples
Beyond basic metrics, analysts apply cohort analysis to group holders by entry date and observe how different cohorts behave during market stress. For example, early investors who entered during a token launch often exhibit lower velocity than later retail buyers. Combining this with network value to transaction ratios helps quantify whether onchain activity supports current valuations. In one illustrative case, an infrastructure token project used these techniques to redesign its staking contract after discovering that 60 percent of large holders were short-term speculators rather than long-term operators.
Teams can replicate this by exporting raw transaction data from Dune Analytics and building custom SQL queries that track cohort retention over multiple quarters.
Common Pitfalls in Interpreting Behavioral Data
One frequent error is overlooking exchange wallets, which can distort concentration readings. Another involves ignoring temporary bridges or staking contracts that temporarily remove tokens from circulation. Always segment data by wallet type before drawing conclusions. Misinterpreting smart contract interactions as individual holder movements is another common issue that leads to inflated velocity estimates. Analysts should also avoid over-relying on single snapshots and instead maintain rolling 90-day averages to smooth out short-term noise.
Conclusion
Behavioral tokenomics provides a powerful framework for understanding 2026 token holder dynamics. By systematically applying concentration, velocity, and duration metrics alongside practical tracking workflows, analysts can design more resilient token economies that balance incentives for both whales and retail participants.
FAQ
How often should analysts refresh onchain metrics?
Daily monitoring works for high-velocity tokens, while weekly reviews suffice for more stable infrastructure assets. Automated alerts reduce the manual workload significantly.
Can behavioral data predict price movements accurately?
It provides strong context for risk assessment but should be combined with broader market indicators for reliable forecasts. No single metric guarantees future price direction.
What tools are essential for 2026 analysis?
Start with Dune Analytics, Nansen, and Arkham Intelligence dashboards for comprehensive holder tracking and alert capabilities.
How do exchange inflows affect concentration readings?
They often create artificial spikes in top-holder percentages, so analysts must filter known exchange addresses before calculating true holder distribution.
Is cohort analysis necessary for every project?
It adds valuable depth for tokens with large holder bases but may be optional for smaller or newer ecosystems where basic metrics already suffice.

No comments yet. Be the first!