 CryptoChain Blog

Introduction to Bonding Curve Tokenomics in 2026
Bonding curves have become a foundational mechanism in decentralized token launches and automated market makers. In 2026, onchain analytics provide unprecedented visibility into how these mathematical functions govern price discovery, liquidity provision, and investor behavior across blockchain networks. This article explores the mechanics, data signals, and practical auditing methods that analysts and builders use to evaluate bonding curve performance. By examining real protocol data, readers can understand how curve parameters influence market dynamics and identify both opportunities and vulnerabilities in token economies. The growing adoption of onchain tools has made it possible to move beyond theoretical models and observe live performance across thousands of transactions daily.
Understanding Bonding Curves and Their Core Mechanics
A bonding curve is a smart contract function that determines token price based on supply. As more tokens are bought, the price increases according to a predefined formula, typically involving exponential or linear relationships. This creates continuous liquidity without traditional order books. Key parameters include the curve's slope, reserve ratio, and initial supply. These directly affect how quickly prices rise and how much capital is required to move the market. Onchain data reveals the real-world effects of these parameters through transaction volumes and holder distributions. Developers often integrate these curves into launch platforms to ensure fair price discovery from the first buyer onward, eliminating the need for pre-mined allocations in many cases.
Curve Parameter Impacts on Price Discovery
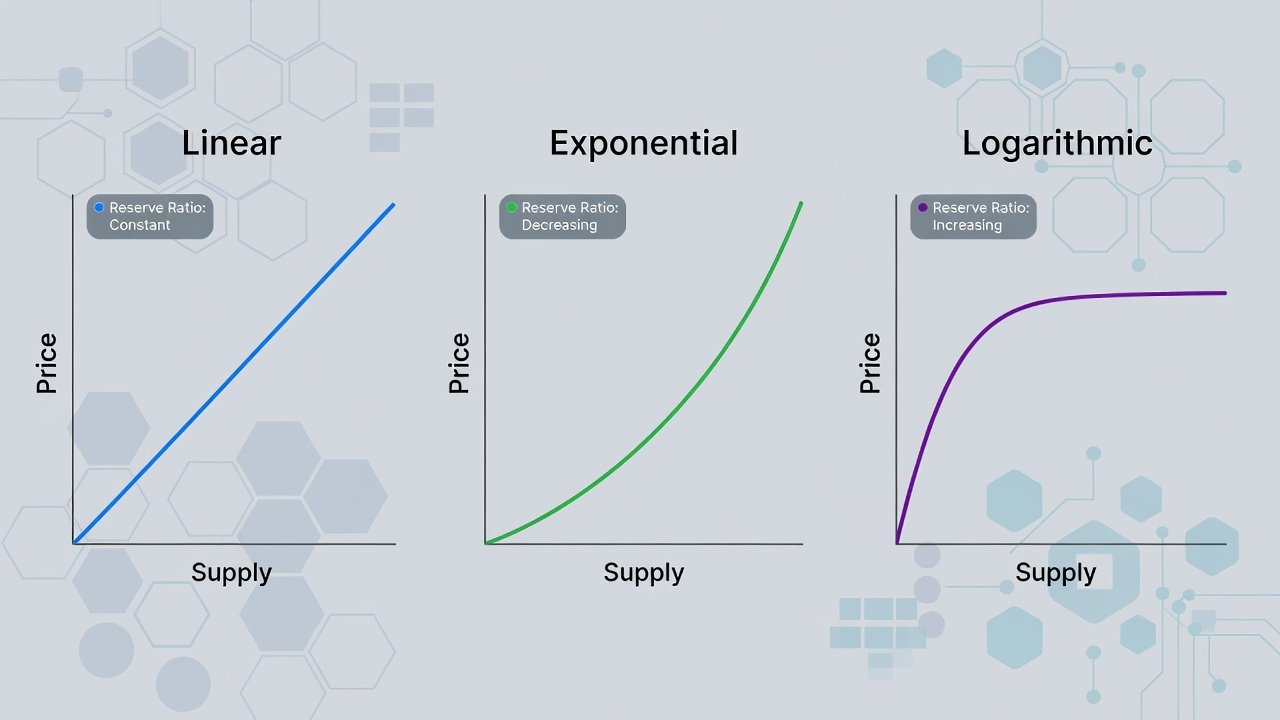
Different curve shapes produce distinct price trajectories. A steep exponential curve accelerates price growth, rewarding early buyers but increasing volatility. Shallower linear curves promote more gradual appreciation and broader participation. Analysts in 2026 track metrics such as price elasticity and reserve utilization rates extracted directly from blockchain logs. These signals help forecast when a token may reach critical liquidity thresholds. Additional parameters like the reserve asset type and fee structures further modulate outcomes, with onchain queries showing how even small adjustments can shift entry points for new participants by significant margins over weeks of trading activity.
Liquidity Dynamics and Market Depth Analysis
Bonding curves inherently tie liquidity to the curve's reserve pool. Onchain analytics measure how quickly reserves deplete during sell pressure and how new buys replenish depth. Tools like blockchain explorers allow users to query reserve balances over time, revealing whether a curve maintains healthy liquidity or risks becoming illiquid at certain supply levels. Market depth is often visualized through cumulative volume charts that highlight inflection points where selling accelerates. In practice, protocols that monitor these dynamics in real time can adjust incentives or pause trading to protect against sudden outflows.
Holder Behavior Signals from Blockchain Data
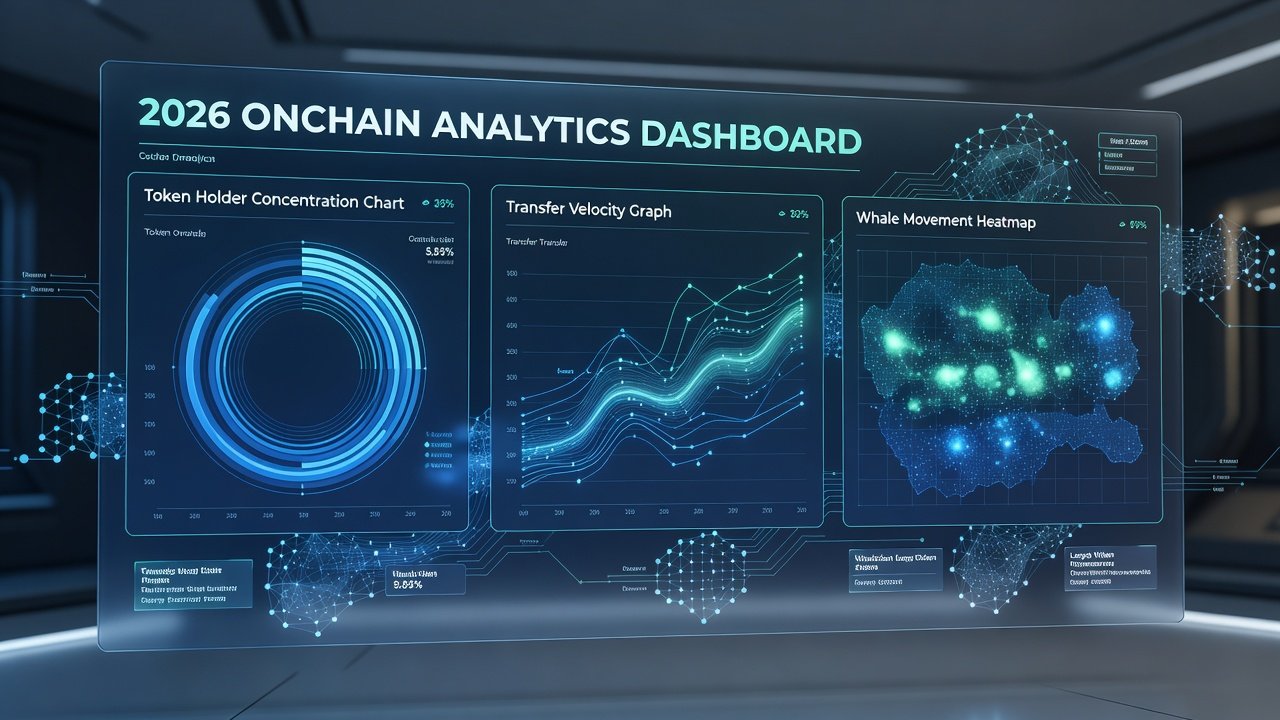
Wallet clustering and transaction pattern analysis uncover holder behavior. Large accumulations followed by rapid distribution often indicate smart money activity, while steady accumulation patterns suggest long-term conviction. 2026 analytics platforms aggregate these signals into dashboards that highlight concentration risks and distribution trends across thousands of addresses. By combining onchain labels with behavioral scoring, analysts can differentiate between speculative traders and committed ecosystem participants, providing clearer insights into sustainable growth versus short-term hype cycles.
Step-by-Step Guide to Auditing Bonding Curve Performance
- Identify the protocol contract address on the target chain using public explorers.
- Query historical mint and burn events using onchain indexing tools to build a complete transaction timeline.
- Calculate effective price at multiple supply points to map the actual curve shape against the intended design.
- Compare observed liquidity against theoretical reserve requirements at each milestone.
- Monitor holder distribution metrics for concentration signals and whale movements.
- Cross-reference volume spikes with external market events to isolate curve-specific effects.
- Generate automated alerts for deviations exceeding predefined thresholds.
This process helps surface discrepancies between intended design and live market behavior while building a repeatable framework for ongoing monitoring.
Real-World Examples from Active Protocols
Leading decentralized exchanges and launch platforms continue to refine bonding curve implementations. Data from these deployments shows how parameter tweaks affect trading volume and holder retention over multi-month periods. One prominent example involves a popular launchpad that shifted from a pure exponential model to a hybrid with logarithmic dampening, resulting in extended holder hold times and reduced early sell-offs. Another protocol integrated dynamic reserve ratios that responded to utilization rates, demonstrating improved resilience during periods of high volatility observed throughout 2025 and into 2026.
Comparisons of Different Curve Models
Exponential curves favor rapid price appreciation but can deter late entrants. Linear and logarithmic variants offer smoother entry points at the cost of slower capital efficiency gains. Onchain comparisons demonstrate clear differences in average hold times and sell pressure tolerance between models. Builders often run side-by-side simulations before mainnet deployment to select the model best aligned with their target user base and liquidity goals. Hybrid approaches that blend multiple curve types are gaining traction as they balance early incentives with long-term accessibility.
Risks Including Manipulation Vectors
Front-running and sandwich attacks remain concerns when curves lack sufficient depth. Flash loan-enabled purchases can artificially inflate prices temporarily, misleading other participants. Onchain monitoring for anomalous transaction sizes helps detect these patterns early. Additional risks include oracle manipulation in hybrid setups and governance attacks that alter curve parameters post-launch. Protocols mitigate these by implementing time delays on parameter changes and maintaining transparent onchain governance records that any user can audit.
Optimization Tips for Builders and Analysts
- Simulate multiple curve parameters against historical market data before deployment to identify edge cases.
- Incorporate dynamic adjustments that respond to reserve utilization thresholds in real time.
- Publish transparent analytics dashboards to build community trust and attract institutional interest.
- Regularly audit for unintended liquidity gaps using automated alerts and third-party reviews.
- Layer complementary mechanisms such as vesting or staking to moderate sell pressure without altering the core curve.
- Engage with onchain data providers for custom metrics tailored to specific curve designs.
FAQ: Common Analytical Pitfalls
How do I verify if a curve is truly decentralized?
Check that the contract owner has renounced privileges and that reserve assets sit in immutable pools rather than controlled wallets. Review the full source code and any upgradeability flags.
What data frequency is ideal for onchain analysis?
Daily snapshots combined with event-level granularity during high-volume periods provide the best balance of insight and noise reduction for most use cases.
Can bonding curves be combined with other mechanisms?
Yes, many protocols layer staking rewards or vesting schedules on top of curves to moderate sell pressure and extend token utility across different market conditions.
What common mistakes occur when interpreting holder data?
Analysts sometimes overlook exchange wallets or liquidity pool addresses, leading to inflated concentration metrics. Always filter known contract addresses before drawing conclusions.
How should teams respond to detected manipulation attempts?
Immediate steps include pausing trading if permitted, notifying the community, and implementing additional slippage controls or circuit breakers in future iterations.
Conclusion
Bonding curve tokenomics remain central to decentralized finance in 2026. Through rigorous onchain analytics, participants can better understand price formation, liquidity health, and behavioral signals. Applying the auditing steps and comparison frameworks outlined above equips readers to evaluate protocols with greater confidence and make informed decisions in evolving token markets. Continued innovation in analytics tooling promises even deeper insights in the years ahead. For further reference, explore resources at ethereum.org, defillama.com, and uniswap.org.
No comments yet. Be the first!