 CryptoChain Blog

Introduction to Data Availability Tokenomics
Data availability layers form a critical part of modern blockchain infrastructure, ensuring that transaction data remains accessible for verification by nodes and rollups. In 2026, investors increasingly turn to onchain analytics to assess the token economics of these protocols amid growing demand for scalable modular blockchains. This guide explores issuance schedules, fee accrual mechanisms, staking dynamics, and holder distribution patterns that determine long-term viability of data availability tokens. Understanding these elements helps differentiate sustainable models from those prone to inflationary pressures or centralization risks. Advanced blockchain analytics techniques reveal hidden trends in protocol revenue and user adoption that traditional market metrics often overlook.
By examining real-world protocol behavior through public ledgers, analysts can forecast whether a token will maintain value as network usage scales. This approach is especially relevant for infrastructure tokens that power emerging ecosystems of appchains and zero-knowledge rollups.
Core Metrics for Evaluating Data Availability Tokens
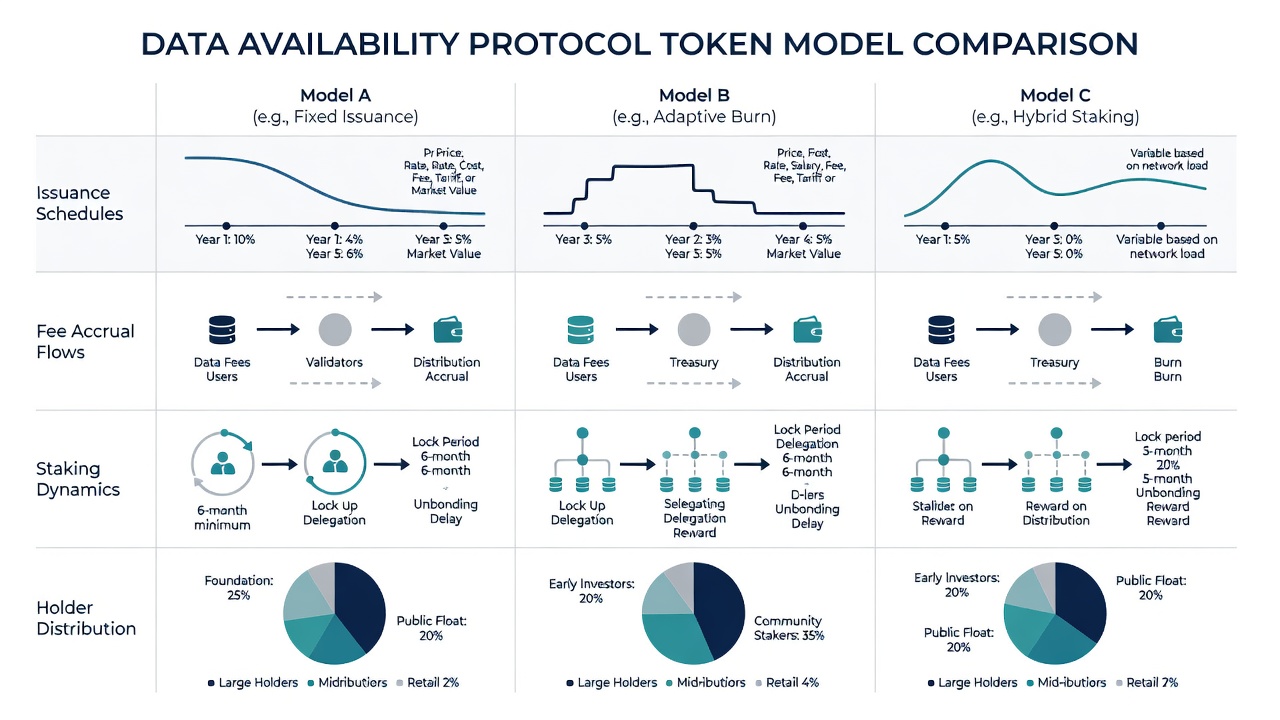
Several quantitative indicators stand out when analyzing token models in depth. Issuance schedules dictate supply growth over time and must be weighed against actual network demand. Fee accrual shows how protocols capture value from data posting activity by rollups and other consumers. Staking dynamics reflect network security levels and the incentives that keep validators engaged. Holder distribution highlights potential governance concentration that could affect future upgrades.
- Track circulating versus total supply ratios monthly to gauge dilution risks from scheduled unlocks or inflationary emissions.
- Monitor fee revenue relative to token emissions to identify protocols achieving net positive cash flow as of 2026.
- Examine staking participation rates alongside average lock-up periods to assess real yield sustainability.
- Analyze top holder concentration using onchain wallet clustering tools that group addresses by behavior patterns.
- Review governance token velocity to understand how often tokens move between staking and active trading.
These metrics together provide a holistic view of sustainability beyond simple market capitalization figures and help investors avoid overvalued assets during hype cycles.
Case Studies of Leading Protocols
Prominent data availability solutions demonstrate varied approaches to tokenomics that offer clear lessons for 2026 analysis. One protocol emphasizes modular design with separate data availability and settlement layers, leading to distinct revenue streams from data blobs posted by multiple rollups. Another integrates directly with existing smart contract platforms, accruing fees through restaking mechanisms that leverage existing validator sets for security.
Practical comparisons reveal differences in emission curves and fee distribution strategies. For instance, some models allocate a portion of fees directly to stakers while others use them for buyback-and-burn strategies that reduce supply over time. Onchain data shows varying levels of holder decentralization across these examples, with some protocols exhibiting more even distribution due to early community airdrops.
Celestia and similar projects illustrate how modular token design influences adoption rates among rollups and appchains. Additional insights emerge when comparing these models against broader ecosystem developments documented on Ethereum, where data availability remains a key scaling focus. A third approach seen in restaking-focused layers ties token utility more tightly to economic security guarantees, creating feedback loops between staking rewards and network usage.
Step-by-Step Methods Using Analytics Tools
Investors can follow a structured process to evaluate tokens rigorously. First, access public blockchain explorers to query issuance events and fee transfers over multiple timeframes. Next, apply clustering algorithms to map holder distributions and detect large wallet movements that may signal impending sell pressure. Then, compare staking reward yields against inflation rates to assess real returns after accounting for token unlocks.
- Query onchain dashboards for daily fee accrual and emission schedules, exporting data for at least six months of history.
- Use wallet labeling services to identify institutional versus retail holders and flag any single-entity dominance above 15 percent of supply.
- Calculate staking participation trends over rolling 30-day windows while cross-checking validator performance metrics.
- Cross-reference with governance proposals affecting token utility and simulate potential outcomes using historical voting data.
- Integrate third-party analytics platforms to visualize correlations between network activity and token velocity.
These steps uncover red flags such as rapid token unlocks coinciding with low network activity or concentrated ownership enabling potential governance attacks. Repeating the process quarterly helps maintain an updated view as protocols evolve.
Potential Red Flags and Common Pitfalls
Warning signs include overly aggressive emission schedules that outpace fee growth by wide margins, or staking mechanisms that favor early participants disproportionately through tiered reward structures. Holder distributions showing single entities controlling over 20 percent of supply warrant extra caution and deeper investigation into vesting contracts. Always verify whether fee mechanisms truly capture value or merely recycle emissions back into the system without net growth. Common mistakes involve ignoring off-chain factors like team token allocations or overlooking how changes in rollup technology could reduce demand for a given data availability layer. Another frequent error is relying solely on total value locked figures without examining the quality and persistence of that locked capital.
Optimization Tips for Portfolio Decisions
Apply findings by diversifying across protocols with complementary token models that balance high-fee accrual with moderate staking requirements. Prioritize those demonstrating consistent fee accrual relative to issuance while monitoring for shifts in holder concentration. Rebalance positions when staking dynamics change due to new restaking integrations or governance updates that alter reward distributions. Combine onchain signals with qualitative assessments of team execution and ecosystem partnerships to build resilient allocations. Track multiple protocols simultaneously using automated alerts on key metrics to respond quickly to emerging trends.
Conclusion
Data availability tokenomics in 2026 reward rigorous onchain analysis that goes beyond surface-level metrics. By focusing on issuance, fees, staking, and distribution, investors gain clearer insights into sustainable opportunities within this infrastructure niche. Regular monitoring with available tools helps navigate evolving blockchain landscapes and supports informed portfolio adjustments.
FAQ
How do issuance schedules impact long-term token value? Predictable schedules aligned with usage growth support value accrual, while unchecked emissions erode holdings through steady dilution.
What role does staking play in network security? High staking ratios enhance security but require monitoring for centralization risks in validator sets that could compromise decentralization goals.
Which analytics tools are most effective for these metrics? Public explorers combined with specialized onchain platforms provide the necessary data granularity for accurate trend identification.
How should investors compare revenue mechanisms across protocols? Focus on net fee retention after emissions and distribution to stakers or treasuries rather than headline revenue numbers alone.
What mistakes should be avoided when assessing holder distribution? Avoid overlooking vesting schedules and smart contract controls that may release large supplies unexpectedly in the future.

No comments yet. Be the first!