 CryptoChain Blog
Introduction to Perpetual DEX Tokenomics in 2026
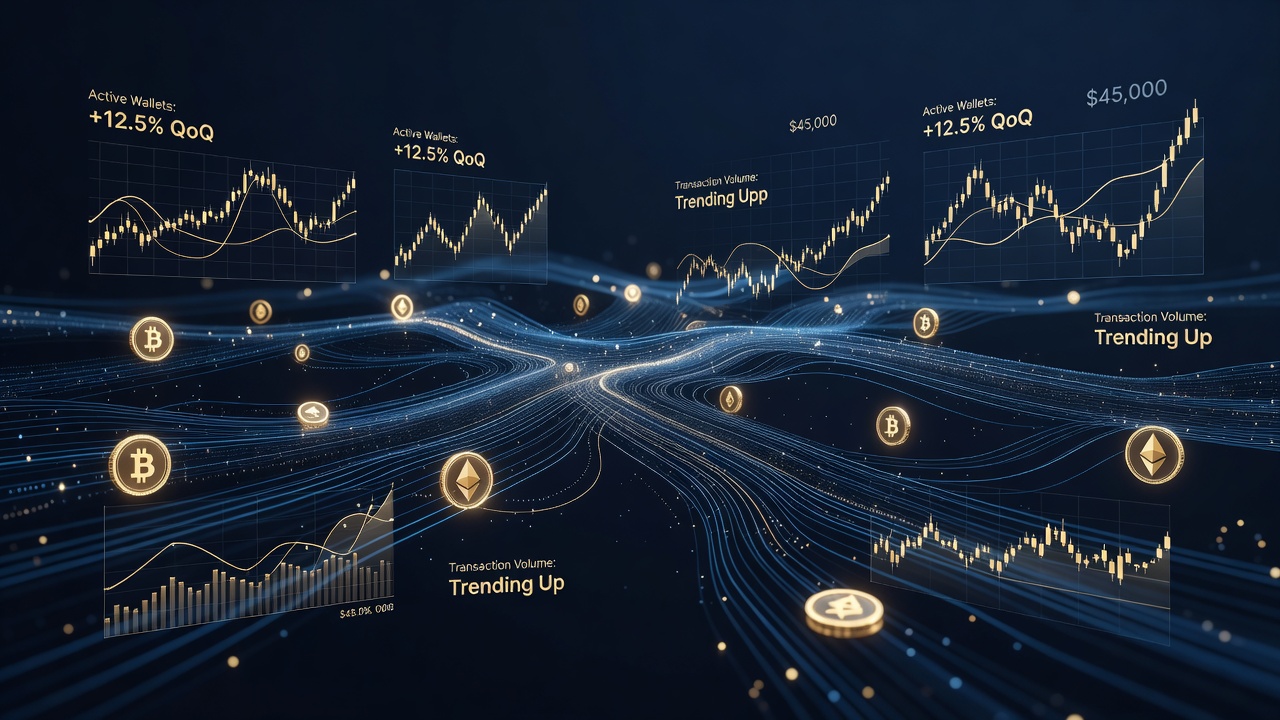
Perpetual decentralized exchanges have become a cornerstone of DeFi by allowing traders to take leveraged positions without traditional order books or centralized intermediaries. In 2026, evaluating their tokenomics demands rigorous onchain analytics that go far beyond headline TVL or trading volume figures. This case study examines how leading protocols structure fee accrual, staking incentives, liquidity provider rewards, supply emissions, and holder distributions using live blockchain data. Traders and analysts seeking sustainable opportunities must understand these mechanics to differentiate protocols built for longevity from those reliant on short-term hype.
Tokenomics in perpetual DEXes directly influence user retention and protocol health. Revenue sharing models determine whether token holders benefit from actual trading activity, while emission schedules control inflation pressures. Onchain tools reveal hidden patterns such as concentrated ownership or mismatched incentives that surface-level dashboards often miss. By combining contract-level data queries with visualization platforms, analysts can build repeatable workflows that surface actionable insights.
Fee Accrual Mechanisms and Revenue Sharing Models
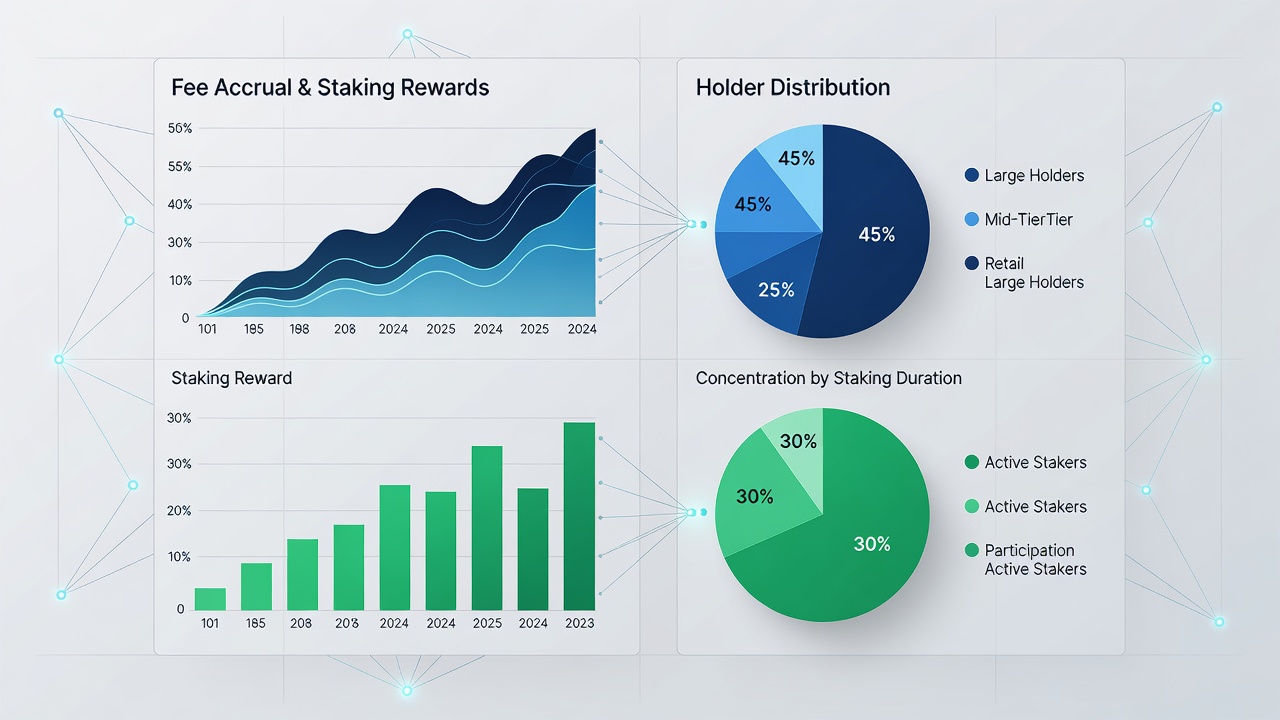
Trading fees form the primary revenue source for perpetual DEX protocols, typically collected on each position opened, closed, or liquidated. These fees flow through smart contracts to treasuries, stakers, and liquidity providers according to predefined allocation rules. Some protocols allocate 40-60% of fees to token stakers via automated buyback-and-distribute mechanisms, while others route portions to insurance funds or development treasuries. Real-time visibility into these flows is possible through event logs emitted by fee distributor contracts.
Revenue sharing sustainability depends on whether fee growth outpaces token emissions. Analysts track cumulative fees collected against token unlocks using dashboards on platforms such as Dune Analytics. Protocols that consistently direct meaningful revenue to stakers tend to exhibit stronger holder retention during market downturns. In contrast, models that prioritize treasury accumulation without clear utility often lead to sell pressure once emissions continue unchecked.
Step-by-Step Workflow for Analyzing Fee Accrual
- Identify the protocol's main fee collector contract address via its documentation or verified source code on a block explorer.
- Query historical fee events using tools like Etherscan to calculate daily and weekly aggregates across multiple chains.
- Build SQL queries on Dune Analytics to segment fees by source (trading, liquidation, funding) and visualize distribution ratios over time.
- Cross-reference treasury wallet outflows with governance proposals to determine whether revenue supports token value or merely funds operations.
- Monitor staking contract inflows to confirm that claimed rewards match actual fee distributions rather than inflationary token mints.
Staking Incentives and Liquidity Provider Rewards
Staking programs lock tokens and align holder incentives with protocol success by sharing a slice of trading revenue. In 2026 many perpetual DEXes offer tiered rewards that increase with lockup duration, encouraging long-term commitment. Liquidity provider rewards supplement base trading fees with governance token emissions, helping maintain depth in high-leverage markets. These dual incentive layers must be balanced; excessive LP emissions can dilute stakers, while overly generous staking rewards may starve liquidity pools.
Holder distribution analysis often reveals concentration risks. Onchain data shows that protocols with large portions held by a few wallets face governance capture or sudden sell-offs at unlock events. Sustainable designs incorporate vesting cliffs and linear releases that align with revenue milestones. Analysts should regularly audit top-holder wallets and vesting contract parameters to anticipate distribution shifts.
Supply Emission Schedules and Sustainability Evaluation
Emission schedules dictate the rate at which new tokens enter circulation, directly affecting inflation and potential dilution. Leading protocols favor multi-year linear or decaying curves rather than aggressive front-loaded releases. Comparing emission rates against actual fee revenue provides a clear sustainability signal: protocols where annual emissions remain below revenue growth demonstrate healthier economics.
Practical evaluation requires tracking emission decay events and their impact on circulating supply. Use onchain queries to monitor mint events from the token contract and overlay them against fee accrual charts. This comparison highlights whether token value accrual mechanisms can absorb ongoing supply increases.
Comparison of Leading Protocols
Examining multiple protocols side-by-side reveals varied approaches to tokenomics. GMX employs a linear emission schedule paired with strong fee sharing to stakers. dYdX uses a decaying emission curve and variable staking rewards tied to governance participation. Newer entrants like Hyperliquid experiment with community-gated emissions and points-based LP incentives. Each model carries distinct risks around inflation control and incentive alignment.
Common Pitfalls to Avoid in Tokenomics Analysis
- Over-relying on TVL without examining fee-to-emission ratios.
- Ignoring cross-chain deployments that fragment liquidity and revenue.
- Failing to account for upcoming large unlocks visible in vesting contracts.
- Assuming all staking rewards come from fees rather than new token mints.
Holder Distribution Patterns and Risk Assessment
Broad token distribution reduces single-point failure risks and improves governance resilience. Onchain analytics tools allow mapping of holder concentration by wallet size and geographic clustering. Protocols showing gradual decentralization through community airdrops and staking incentives tend to weather volatility better. Red flags include heavy team or investor allocations without corresponding lockups.
Regular audits of distribution metrics should form part of any analyst routine. Combine wallet clustering analysis with active address growth to gauge organic adoption versus mercenary capital.
Actionable Insights for Traders and Analysts
Build personal dashboards that combine fee flow data, staking participation rates, and emission schedules. Set alerts for large treasury movements or sudden changes in holder concentration. Cross-reference multiple data sources to avoid blind spots from single-tool reliance. These workflows turn raw onchain data into decision-useful intelligence for position sizing and protocol selection.
FAQs on Perpetual DEX Tokenomics
How do I verify if staking rewards are sustainable? Compare protocol-reported fee revenue against actual staking reward payouts using onchain transaction data over at least three months.
What metrics indicate healthy holder distribution? Look for decreasing Gini coefficients and increasing numbers of wallets holding meaningful but non-controlling stakes.
Can emission schedules be changed? Many protocols allow governance votes to adjust emissions, so monitor proposal history for potential future changes.
Conclusion
Perpetual DEX tokenomics in 2026 reward disciplined onchain analysis. By mastering fee accrual tracking, staking dynamics, emission comparisons, and distribution monitoring, traders and analysts can identify protocols with durable economics. Apply these expanded workflows consistently to navigate evolving DeFi markets with greater confidence and precision.


No comments yet. Be the first!