 CryptoChain Blog

Introduction to Tracking Decentralized Compute Token Emissions
Decentralized compute networks have emerged as a cornerstone of Web3 infrastructure, powering everything from AI training to rendering workloads. In 2026, monitoring token emissions is essential for understanding supply dynamics, reward sustainability, and network health. This guide delivers immediate, actionable steps to track emissions schedules, reward distributions, and staking impacts using onchain data. Analysts and token researchers need reliable methods to interpret how new tokens enter circulation and influence market behavior. Without proper tracking, it becomes difficult to distinguish between healthy incentive mechanisms and unsustainable inflationary pressures that erode token value over time.
Readers will learn concrete workflows with blockchain analytics platforms, review real-world 2026 case studies from prominent networks, compare different emission models, and build custom dashboards tailored to their research needs. Common pitfalls such as misreading over-emission signals and holder behavior patterns receive dedicated attention, helping users avoid costly misinterpretations. The focus remains on practical, data-driven approaches that deliver results for both novice and experienced DeFi participants.
Key Onchain Metrics for Emissions Monitoring
Effective tracking begins with core metrics that reveal the health of any compute token economy. Focus first on circulating supply changes, which show how quickly new tokens are released through emissions. Track emission rates per epoch or block interval to understand the velocity of new supply. Reward allocation ratios provide insight into how much of each emission batch goes to validators, delegators, or treasury reserves. Monitor total value locked alongside staking participation percentages to gauge dilution risks accurately. Transaction volume data helps identify distribution patterns across validator and delegator addresses, highlighting whether rewards concentrate in a few wallets or spread broadly.
Additional metrics include unlock schedules visible in vesting contracts and daily emission caps enforced by protocol parameters. Cross-reference these figures with network utilization rates to assess whether emissions align with actual compute demand. For example, a rising emission rate paired with flat utilization often signals potential over-supply. Analysts should also watch for changes in average holding periods, which indicate whether newly emitted tokens are being staked or immediately sold on exchanges.
Blockchain Analytics Tools and Practical Steps
Start with Dune Analytics for custom SQL queries on emission events across multiple chains. Connect to relevant smart contracts and query daily minted tokens while filtering out noise from unrelated transfers. Next, leverage Etherscan or equivalent block explorers for real-time balance tracking of treasury and staking contracts. These tools allow users to set up alerts for large mint transactions that could indicate emission schedule adjustments.
Step 1: Identify emission contract addresses from official project documentation and verified source code. Step 2: Build queries that filter for mint, transfer, and stake events within specific time ranges. Step 3: Visualize trends over rolling 30-day windows to spot anomalies quickly. Step 4: Export cleaned data to Google Sheets or Python notebooks for deeper statistical analysis of reward distribution patterns. Step 5: Combine onchain data with offchain metrics such as active node counts to create a complete picture. Dune Analytics offers community dashboards that can be forked and customized for compute-specific tokens. Supplement these with Etherscan for granular transaction inspection and DefiLlama for aggregated TVL and staking statistics.
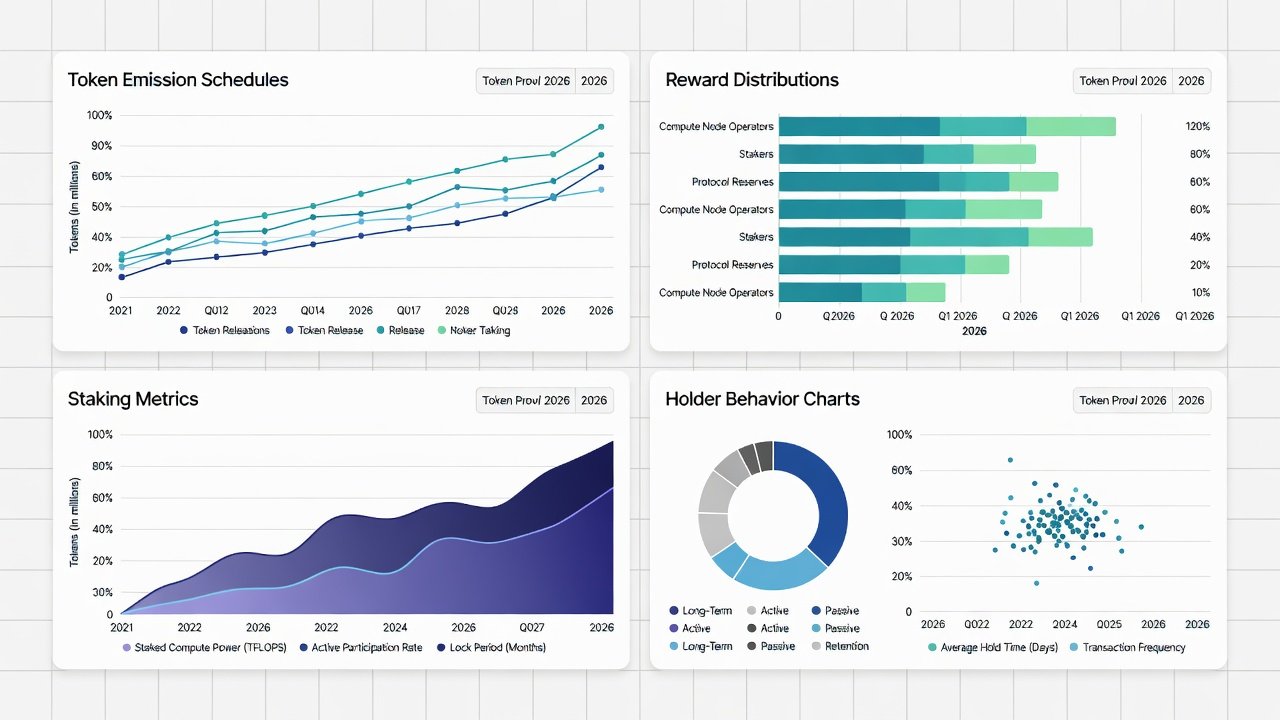
Reward Distribution Patterns in Practice
Reward distribution patterns reveal how emissions flow through the network. Some protocols release tokens in fixed daily batches to all active nodes, while others weight rewards according to compute contribution or uptime scores. Onchain analysis shows that weighted models tend to reduce concentration risk by favoring high-performing operators. Track the ratio of rewards claimed versus rewards staked to measure user confidence. Sudden spikes in claimed but un-staked rewards often precede increased selling pressure on exchanges.
2026 Case Studies from Leading Compute Networks
Akash Network demonstrated controlled emissions in early 2026 by tying rewards directly to actual deployment usage rather than fixed schedules. Onchain data revealed a 12 percent reduction in monthly emissions following utilization spikes, which helped stabilize token supply. Render Network adjusted its model mid-year, shifting 30 percent of emissions toward node operators meeting strict performance thresholds, a change clearly visible through staking contract interactions. Another example comes from a smaller compute project that implemented dynamic halving triggers based on total compute hours delivered. These case studies highlight how leading networks balance growth incentives with long-term token sustainability through transparent onchain mechanisms that any analyst can verify independently.
Comparing Emission Models
Linear emission models provide predictable supply increases but risk over-dilution during low-demand periods. Halving-based schedules introduce scarcity yet can create volatility in reward expectations when block rewards drop sharply. Dynamic models that adjust based on network utilization offer better alignment with real compute workloads and tend to maintain healthier token velocity. Analysts should compare models by examining historical emission curves and their correlation with token price stability and staking retention rates. A practical comparison table might list factors such as predictability, adaptability, and historical performance during bear markets.
- Linear models suit networks with steady growth forecasts but require careful cap monitoring.
- Halving models appeal to scarcity-focused communities yet demand strong demand-side catalysts.
- Dynamic models provide flexibility but require sophisticated onchain governance to implement correctly.
Building Actionable Dashboards
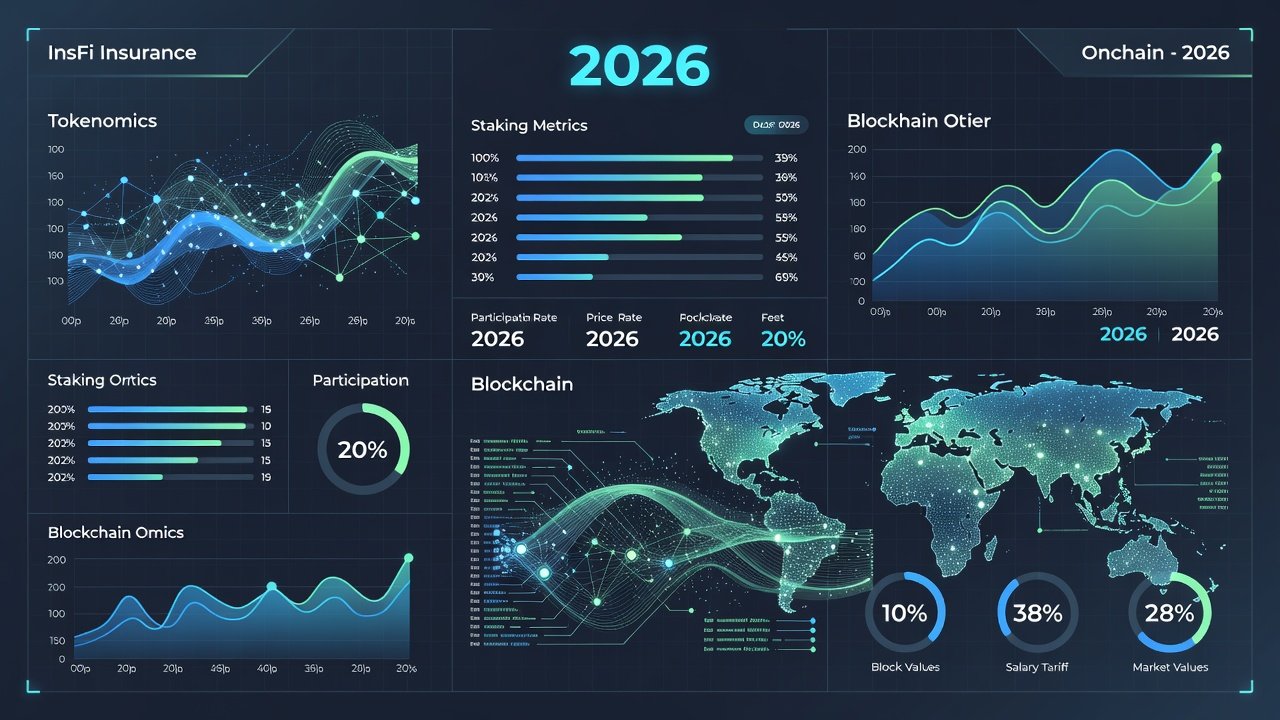
Create a dashboard that tracks emission rate versus network utilization in real time. Include widgets for staking APR trends and holder concentration metrics derived from token distribution data. Use Dune to set alerts on unusual mint events exceeding average daily volumes by more than two standard deviations. Incorporate holder behavior filters to separate long-term stakers from short-term speculators. This separation reveals whether emissions support productive network participation or merely fuel speculative trading activity. Update dashboard queries monthly to reflect protocol upgrades or parameter changes announced through governance forums.
Staking Impacts Analysis
Staking impacts directly influence how emissions affect token economics. Higher staking ratios typically indicate that emissions are being productively locked, which reduces immediate sell pressure and supports price stability. Conversely, declining staking participation despite rising emissions often signals waning confidence. Track the percentage of circulating supply that remains staked over time and correlate it with emission events. This analysis helps researchers forecast potential selling waves when large unlock periods coincide with low staking incentives.
Common Pitfalls and Interpreting Holder Behavior
Over-emission signals often appear as sudden spikes in circulating supply without corresponding usage growth. Always verify against utilization metrics before concluding inflationary pressure exists. Misinterpreting large holder movements can lead to false panic; examine whether transfers represent staking inflows or exchange deposits. Review vesting contract unlocks separately from ongoing emissions to avoid conflating scheduled releases with reward distributions. Another frequent error involves ignoring chain-specific differences in gas costs that can distort apparent reward values when comparing across networks.
FAQ on Practical Tracking Workflows
How often should emissions be checked?
Daily monitoring of mint events combined with weekly trend analysis provides sufficient oversight for most DeFi analysts and token researchers.
Which tools are best for beginners?
Begin with free explorers such as Etherscan before advancing to SQL-based platforms like Dune for custom queries and visualizations.
How do staking impacts affect emission interpretation?
Higher staking ratios typically indicate emissions are being productively locked, reducing immediate sell pressure and supporting long-term network health.
What signals indicate healthy emission schedules?
Consistent alignment between emissions and network revenue or utilization metrics points to sustainable tokenomics that reward actual usage rather than speculation.
Can dashboards be shared or automated?
Yes, most analytics platforms allow dashboard sharing via links and scheduled email reports for ongoing monitoring without manual checks.
Conclusion
Tracking decentralized compute token emissions requires a disciplined, data-first approach that combines multiple onchain metrics with practical tooling. By following the steps outlined above, analysts can build reliable workflows that surface both opportunities and risks early. Continuous refinement of dashboards and regular review of case studies will keep researchers ahead of evolving emission strategies in the fast-moving 2026 landscape.
No comments yet. Be the first!