 CryptoChain Blog
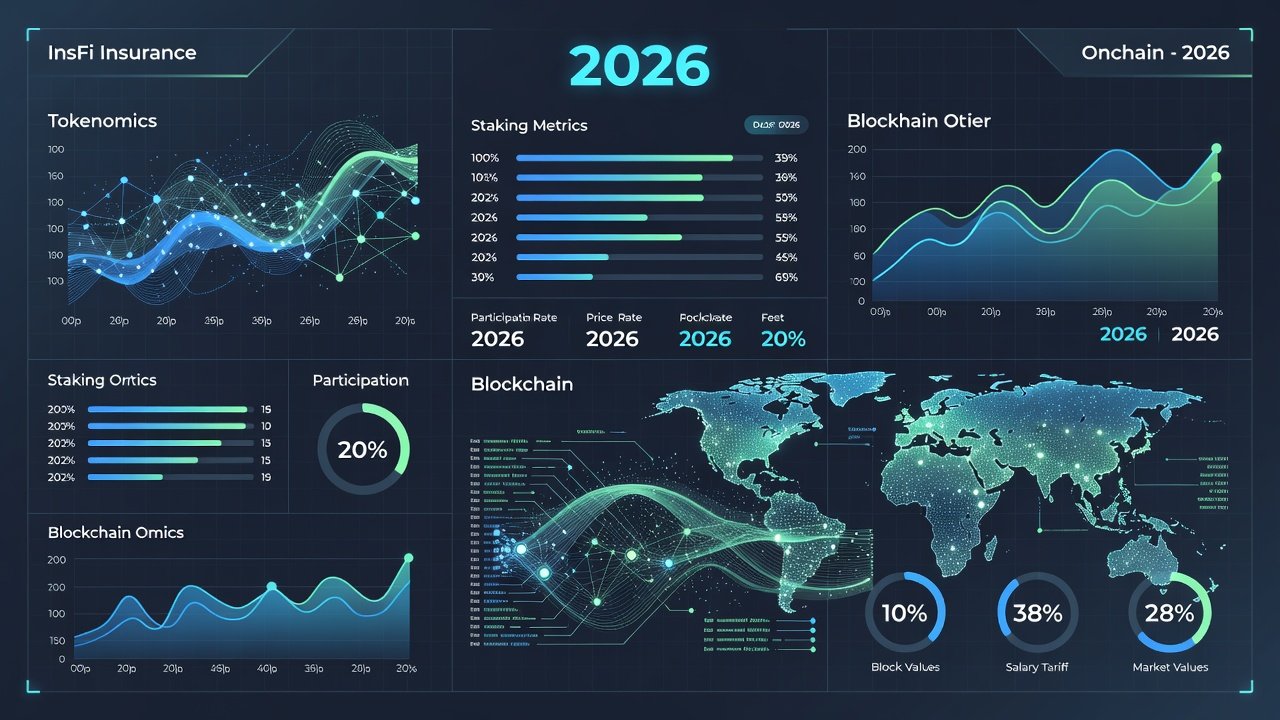
Introduction to DeFi Insurance Tokenomics in 2026
DeFi insurance protocols have evolved into sophisticated systems by 2026, where tokenomics directly influence their ability to underwrite risk and maintain user trust. Onchain analytics offer unprecedented visibility into these economic structures, allowing participants to evaluate sustainability beyond surface-level metrics. This breakdown explores concrete case studies from established protocols, focusing on supply mechanics, staking incentives, claims flow tracking, and liquidity pool health. Readers will gain practical methods for monitoring key indicators and identifying potential issues before they impact portfolios.
The growth of decentralized insurance stems from increasing demand for coverage against smart contract exploits, stablecoin depegs, and market volatility. Tokenomics design determines whether a protocol can attract capital during bull markets and retain it during downturns. Onchain data from public blockchains reveals real-time adjustments in token supply, reward distributions, and capital utilization that traditional finance cannot match.
Supply Mechanics in DeFi Insurance Protocols
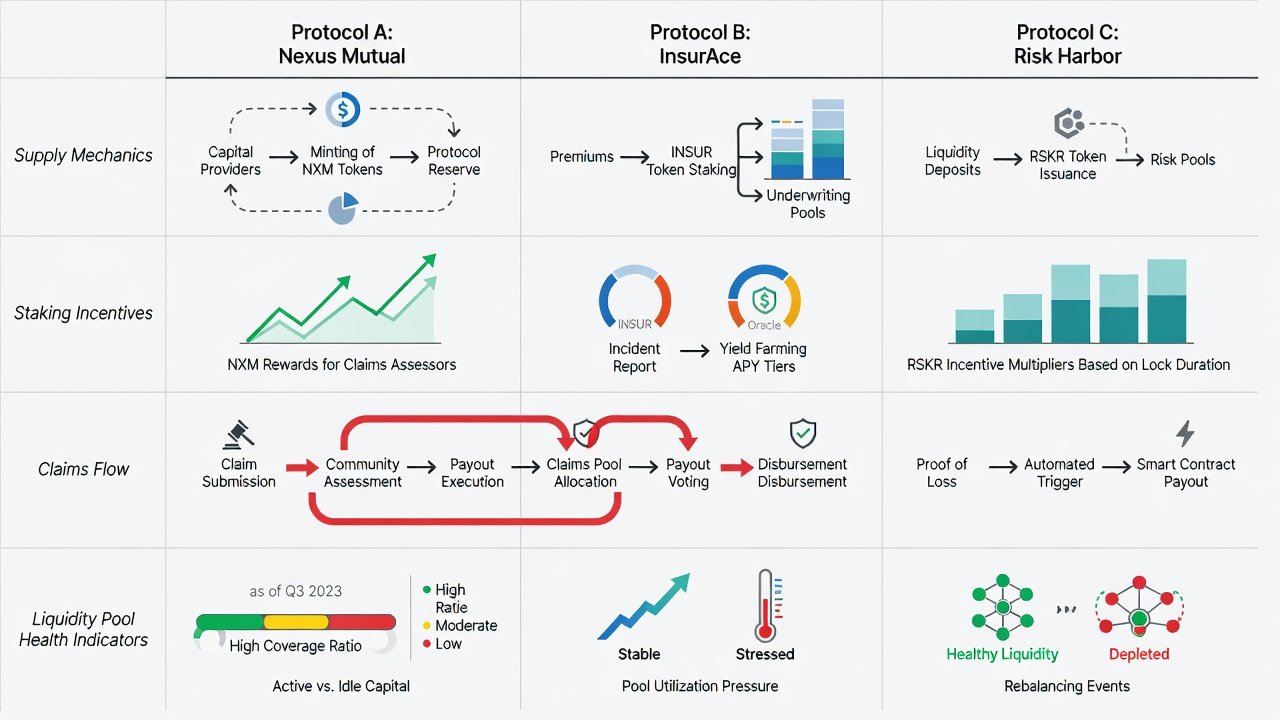
Token supply mechanics form the foundation of coverage capacity. In protocols such as Nexus Mutual, new tokens enter circulation through bonding curves that tie issuance to incoming capital. This creates a direct relationship between staked assets and available underwriting limits. Onchain queries of minting events show how supply expands only when reserves support additional policies.
Other protocols employ fixed-supply models with inflationary rewards funded by premium income. Analysts examine contract storage variables to track how unissued tokens are allocated for future incentives. Case studies from 2026 demonstrate that protocols with transparent supply schedules experience lower volatility in token prices during claims events. Monitoring involves reviewing historical transaction logs to correlate supply increases with coverage growth.
Staking Incentives and Alignment
Staking incentives encourage long-term capital commitment by distributing governance tokens and premium revenue shares. Effective designs incorporate vesting periods and slashing conditions that penalize premature withdrawals. Onchain event logs reveal the frequency and size of reward distributions, helping users assess whether incentives remain aligned with protocol needs.
Practical monitoring steps include: first, querying staking contract addresses for current reward rates; second, comparing emission schedules against total value locked trends; third, reviewing governance proposals that alter incentive parameters; and fourth, simulating reward scenarios using historical claims data. These methods highlight protocols where incentives promote sustainable growth rather than short-term pumping.
Claims Flow Tracking and Reserve Ratios
Claims processing relies on oracle feeds and decentralized voting to approve payouts. Reserve ratios, defined as available capital divided by total coverage outstanding, indicate a protocol's ability to meet obligations. Healthy ratios above 1.5x provide buffers against clustered claims. Onchain dashboards aggregate these figures from multiple contracts for daily tracking.
Step-by-step reserve monitoring begins with pulling treasury balances from protocol wallets. Next, sum active coverage commitments across all underwriting pools. Then calculate the ratio and compare it to historical averages. Finally, set automated alerts for ratio declines and investigate underlying causes such as rapid coverage growth or delayed claims settlements. Real-world examples show how protocols maintaining consistent ratios avoided liquidity crises during 2025 market stress.
Liquidity Pool Health Analysis
Liquidity pools enable efficient entry and exit for stakers while supporting coverage issuance. Key health indicators include utilization rates, which measure how much capital is actively backing policies, and withdrawal queue lengths during high-demand periods. Protocols adjust fees dynamically based on pool utilization to maintain balance.
Case studies reveal that pools with diversified asset backing exhibit greater resilience. Onchain analysis tracks impermanent loss exposure through price feed integrations and compares pool performance across different market conditions. Users benefit from reviewing pool composition data to avoid over-concentration in volatile assets.
Comparisons Between Top Protocols
Nexus Mutual prioritizes community governance and mutualized risk sharing, resulting in slower but more deliberate capital allocation. Alternative protocols leverage parametric triggers for automated claims, achieving faster payouts at the cost of higher false-positive rates. Onchain comparisons of capital efficiency metrics demonstrate that governance-heavy models retain more reserves during volatile periods.
Another emerging approach uses tokenized reinsurance layers to distribute risk across multiple chains. Analytics from 2026 show variations in response times and staker retention rates. These differences help investors select protocols matching their risk tolerance and time horizons.
Red-Flag Detection Techniques
- Watch for sudden coverage expansions without matching reserve inflows, which often precedes liquidity shortfalls.
- Examine governance proposals that shift reward distributions toward team allocations or reduce staker shares.
- Analyze withdrawal patterns in liquidity pools for signs of coordinated exits by large holders.
- Review oracle performance histories and dispute resolution outcomes to detect reliability issues.
- Compare premium income against claims payouts over rolling 90-day windows to spot unsustainable underwriting.
Applying Insights to Portfolio Decisions
Portfolio managers can integrate onchain tokenomics analysis into due diligence processes. Diversification across protocols with differing supply models and incentive structures reduces exposure to single-point failures. Regular monitoring of reserve ratios and claims flows supports proactive rebalancing decisions.
Practical application includes building personal dashboards that aggregate data from multiple sources and setting threshold alerts for key metrics. This approach transforms raw onchain information into actionable portfolio signals.
FAQ
How do I start tracking reserve ratios onchain?
Connect to public blockchain explorers and query protocol treasury and coverage contracts. Set up recurring scripts or use analytics platforms to automate ratio calculations and historical comparisons.
What red flags indicate unsustainable staking incentives?
Excessive reward emissions without corresponding premium revenue or coverage demand often signal future dilution. Review emission schedules against actual protocol income for early warnings.
Are liquidity pools in insurance protocols different from lending pools?
Yes, insurance liquidity supports risk coverage rather than borrowing activity, leading to distinct utilization patterns and fee mechanisms tailored to claims probability.
How can onchain analytics improve claims flow predictions?
By analyzing historical oracle dispute rates and voting participation, users can forecast payout delays and adjust coverage allocations accordingly.
Conclusion
2026 onchain analytics provide powerful tools for dissecting DeFi insurance tokenomics. Through detailed examination of supply mechanics, staking incentives, claims tracking, and liquidity health, participants gain the clarity needed for informed decisions. Resources such as DefiLlama, Etherscan, and Chainlink deliver the foundational data required for ongoing evaluation and sustainable portfolio construction.

No comments yet. Be the first!