 CryptoChain Blog

Introduction to 2026 Compute Network Tokenomics
Decentralized compute networks have evolved significantly by 2026, with tokenomics models emphasizing sustainable emissions and targeted reward distributions. These systems power AI training, rendering, and data processing across global nodes. Analysts now rely on onchain data to evaluate how emissions schedules align with network utility and holder incentives. As compute demand surges from machine learning workloads and decentralized applications, the design of token emissions becomes critical for maintaining network security and participation. Velocity tracking helps measure how quickly tokens circulate, revealing whether rewards drive genuine usage or mere speculation. Staking mechanisms further influence distribution signals visible through blockchain analytics platforms, providing DeFi and infrastructure readers with actionable signals beyond surface-level metrics.
By examining real-world 2026 implementations, analysts can identify patterns that separate resilient networks from those prone to inflationary spirals. This deeper exploration covers practical auditing techniques, comparative analysis, and early warning indicators for unsustainable designs.
Emissions Schedules in Major Compute Networks
Emissions refer to the rate at which new tokens enter circulation. In 2026, leading projects balance inflation with demand from compute providers. Case studies show varied approaches, from linear reductions to dynamic adjustments based on utilization metrics. One prominent network implements a monthly emission cap that decreases proportionally to verified compute hours delivered, ensuring new supply matches actual network growth rather than arbitrary timelines. Another adopts a hybrid model combining fixed base emissions with bonus allocations triggered by exceeding performance thresholds in node uptime and task completion rates.
These schedules directly impact token value stability and participant motivation. Overly aggressive emissions without corresponding demand can erode holder confidence, while conservative models may fail to attract new compute providers during rapid scaling phases.
Step-by-Step Example of Auditing Reward Flows
- Query the token contract for total supply and emission events using tools like Dune Analytics to establish baseline issuance rates over multiple epochs.
- Track reward smart contract addresses to map distributions to stakers and compute nodes, categorizing flows by recipient type and frequency.
- Analyze transaction logs for velocity patterns over 30-day windows, calculating average turnover rates and correlating them with onchain compute job submissions.
- Cross-reference holder distribution via onchain explorers to identify concentration risks, paying special attention to top wallet clusters and their historical reward accumulation.
- Validate results against offchain telemetry from network dashboards to confirm that claimed compute contributions align with onchain reward claims.
This process highlights whether emissions support long-term network health and provides reproducible methods for dashboard builders seeking repeatable audits.
Staking Incentives and Holder Distribution Signals
Staking incentives encourage token lockups that reduce circulating supply. Effective models tie rewards to compute contributions rather than pure holding. Holder distribution signals, such as Gini coefficients derived from wallet data, indicate decentralization levels. In practice, networks that weight staking yields toward active compute nodes rather than passive holders tend to exhibit healthier distribution curves, with fewer tokens concentrated among early investors.
Analysts monitor these metrics to spot early warnings of centralization that could undermine trust in reward mechanisms. For instance, sudden spikes in staking from a small number of addresses often precede governance attacks or coordinated sell pressure once unlock periods arrive.
Comparisons Between Leading Networks
Comparing networks reveals best practices. One project uses capped emissions tied to usage milestones, while another employs halving events similar to Bitcoin. Ethereum.org documentation provides foundational insights into proof-of-stake reward flows applicable here. A third network prioritizes dynamic staking yields based on real-time compute demand, offering higher incentives during peak periods. Side-by-side evaluation shows that usage-tied models reduce volatility in token velocity compared to fixed-schedule alternatives. Infrastructure teams evaluating multiple chains can apply these comparisons when selecting networks for deployment or integration.
Spotting Unsustainable Emissions Early
- Monitor emission-to-usage ratios exceeding network growth rates, which often signals impending dilution of token value.
- Watch for reward concentration in fewer than 10 wallets, a clear indicator of potential governance capture or liquidity shocks.
- Track velocity spikes without corresponding compute activity increases, suggesting speculative trading rather than productive network use.
- Use alerts on platforms tracking token unlocks and vesting schedules to anticipate large supply injections before they impact markets.
- Compare quarterly emission data against actual node onboarding numbers to detect mismatches between promised and delivered incentives.
Early detection allows analysts to adjust dashboard models proactively and avoid exposure to networks with deteriorating fundamentals.
Practical Analytics Tools for 2026 Insights
Blockchain analytics platforms enable detailed tracking. Integrate APIs for real-time emission data and combine with offchain compute metrics for holistic views. Chain.link oracles often feed verified utilization data into these systems, enhancing accuracy of reward calculations. Additional tools include custom Python scripts querying GraphQL endpoints for staking participation trends and visualization layers that overlay emission curves with holder concentration heatmaps.
Building these integrations requires attention to data freshness, as 2026 networks update reward parameters frequently based on governance proposals.
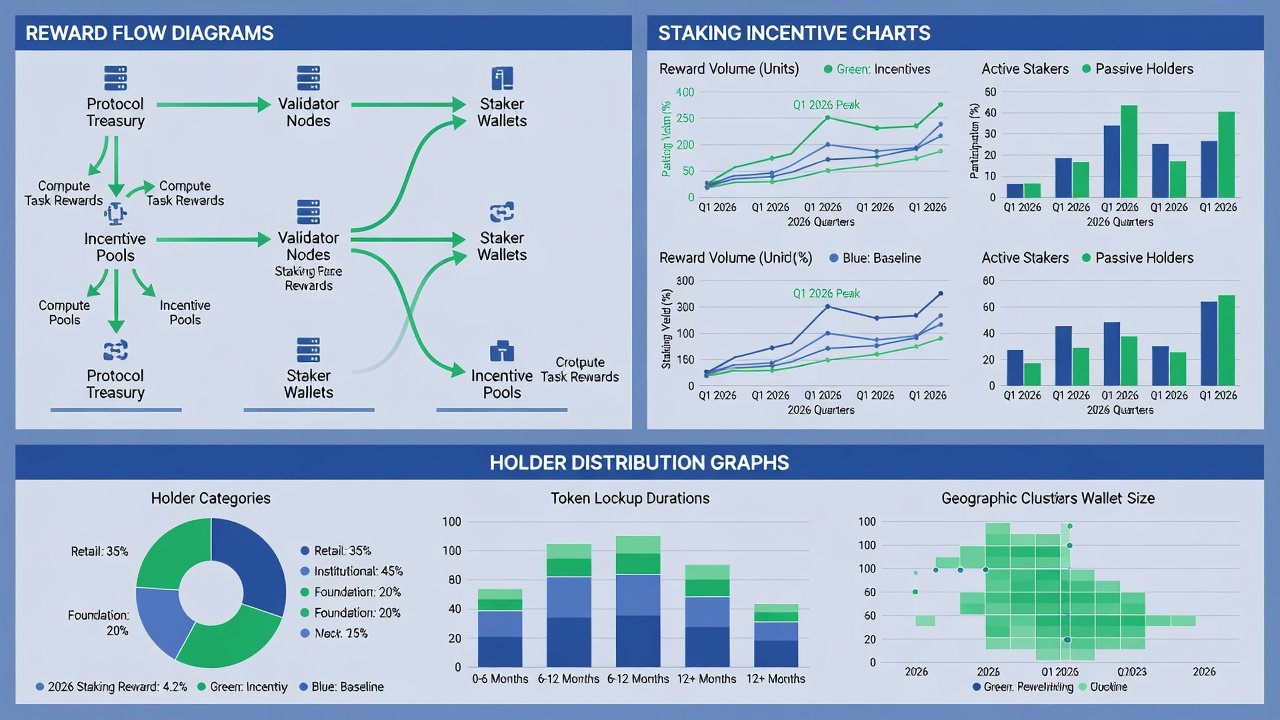
Building Custom Dashboards for Analysts
Creating effective dashboards involves layering multiple data sources. Start by pulling emission events into a time-series database, then overlay staking reward claims and compute job metrics. Add filters for different network segments such as GPU versus CPU providers to isolate performance variations. Include comparative charts that benchmark velocity against peer networks, allowing quick identification of outliers. Analysts should also incorporate alert systems that notify when distribution Gini coefficients cross predefined thresholds or when reward flows deviate from historical averages by more than 15 percent. These practical steps transform raw onchain data into decision-useful intelligence for DeFi strategies and infrastructure planning.
FAQs for Dashboard Builders
How do emissions affect token velocity?
Higher emissions can accelerate velocity if rewards flow directly into trading rather than staking or usage. In contrast, emissions paired with strong staking incentives tend to dampen velocity, supporting more stable token economics over extended periods. Dashboard builders should segment velocity calculations by reward recipient cohorts to isolate these effects accurately.
What signals indicate healthy reward mechanisms?
Balanced holder distribution and emissions correlated with compute demand point to sustainability. Additional positive signals include consistent staking participation rates above 60 percent of circulating supply and reward claim patterns that align closely with verified task completions rather than simple time-based unlocks.
Which tools best track 2026 onchain data?
Platforms offering granular transaction and staking analytics deliver actionable insights beyond basic overviews. Combining onchain explorers with oracle-fed utilization data and custom scripting environments provides the depth required for professional-grade dashboards in the current landscape.
Conclusion
2026 onchain tokenomics for compute networks demands rigorous analysis of emissions and rewards. By applying velocity tracking, auditing flows, and monitoring distribution signals, DeFi and infrastructure readers can identify robust projects. Continued refinement of these models will shape the next generation of decentralized infrastructure. Bitcoin.org resources on monetary policy offer additional context for emission design principles that remain relevant across evolving compute ecosystems.

No comments yet. Be the first!