 CryptoChain Blog

Introduction to L2 Tokenomics in 2026
Layer 2 solutions have become essential for Ethereum scalability, yet understanding their token economics demands rigorous onchain analysis. In 2026, analysts rely on advanced blockchain tools to dissect supply dynamics, fee mechanisms, and revenue distribution. This comprehensive guide provides detailed workflows for comparing L2 scaling solutions, tracking sequencer revenues, evaluating staking distributions, and measuring bridge liquidity. Real-world examples from Arbitrum, Optimism, zkSync, and Base illustrate how to identify sustainable token models versus those prone to inflation or centralization risks. Readers will gain practical skills to perform independent evaluations using publicly available dashboards and queries.
Understanding Core L2 Token Models
Layer 2 token models typically revolve around governance rights, fee redistribution, and staking incentives. Optimistic rollups like Arbitrum and Optimism use native tokens for voting on upgrades and allocating sequencer revenues. Zero-knowledge rollups such as zkSync emphasize token utility in proof generation and validator rewards. Supply dynamics play a critical role: many projects implement inflationary schedules tied to network growth, while others incorporate deflationary burns from transaction fees. Fee mechanisms often split revenues between sequencers, validators, and token holders. Onchain data reveals whether emissions support long-term security or merely subsidize short-term activity. Analysts must examine token allocation schedules, vesting cliffs, and circulating supply trends to forecast dilution risks.
Tracking Sequencer Revenue Flows
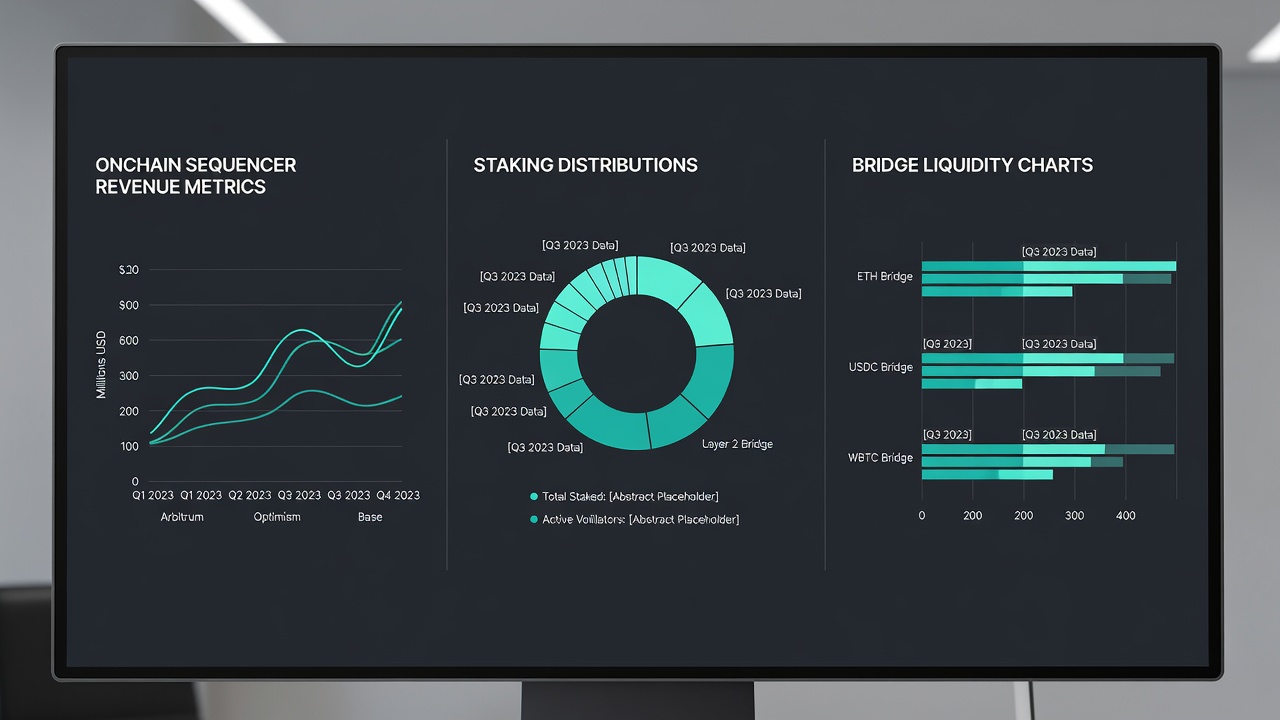
Sequencers process transactions and capture the majority of fees plus maximal extractable value. In 2026, leading L2s have begun decentralizing these roles, but revenue concentration remains a key metric. Begin analysis by locating sequencer smart contract addresses through official documentation or block explorers. Query historical fee transfers and MEV redistribution events to calculate daily, weekly, and monthly revenue shares. Normalize these figures against total transaction volume to derive efficiency ratios. For instance, Arbitrum's sequencer has historically directed portions of revenue toward ecosystem grants, while Optimism allocates to public goods funding. Use platforms like Dune Analytics to build custom dashboards that visualize these flows over time. Cross-reference with L2Beat for aggregated metrics on total value secured and fee generation.
Detailed Step-by-Step Workflow
- Locate sequencer contract addresses via project GitHub repositories or official docs.
- Query onchain fee recipient events using SQL on Dune or similar analytics platforms.
- Calculate net revenue after gas costs and compare across multiple L2s for relative performance.
- Monitor MEV auction results to assess additional income streams and centralization signals.
- Track 30-day moving averages to identify seasonal patterns or sudden drops in activity.
- Validate findings against raw blockchain data from explorers to rule out off-chain adjustments.
Validator Staking Distributions and Security
Staking mechanisms secure the network and influence token velocity. Review delegation patterns, validator set sizes, and slashing history to gauge decentralization levels. Optimism, for example, has implemented staking pools that reward participants based on uptime and governance participation. Analyze onchain staking contracts to determine average lock-up periods and reward distribution schedules. High concentration among a few validators signals potential risks, while broad distribution enhances resilience. Compare staking yields across L2s by querying reward claim events and dividing by total staked amounts. This data helps determine whether token incentives adequately compensate for opportunity costs and security contributions.
Bridge Liquidity Metrics and Risks
Cross-chain bridges represent critical infrastructure whose liquidity directly impacts token utility. Monitor total value locked ratios, withdrawal queue lengths, and liquidity provider incentives using aggregated dashboards. Sustainable models maintain balanced inflows and outflows to prevent liquidity crunches during high-volatility periods. Track bridge-specific events such as deposit and withdrawal volumes to spot anomalies. Projects like Arbitrum and zkSync integrate with multiple bridges, requiring analysts to evaluate each for security audits and insurance coverage. Consistent monitoring of these metrics reveals whether bridge activity supports or undermines the underlying token economy.
Supply Dynamics and Fee Mechanisms
Beyond revenue tracking, examine how token supply evolves through emissions, burns, and unlocks. Many L2s schedule monthly or quarterly unlocks for team and investor allocations. Fee mechanisms often include partial burns that reduce circulating supply over time. Compare burn rates against new issuance to calculate net supply pressure. Real examples demonstrate that models combining high usage with aggressive burns tend to exhibit stronger long-term token value accrual. Use onchain queries to verify actual burn transactions and correlate them with network activity spikes.
Comparison Table of Leading L2s
| L2 | Token Utility | Sequencer Model | Staking Availability | Bridge Integration |
|---|---|---|---|---|
| Arbitrum | Governance, fee sharing | Transitioning to decentralized | Yes via pools | Multiple bridges |
| Optimism | Governance, public goods | Decentralizing | Yes | Optimism bridge + others |
| zkSync | Proof generation, staking | Decentralized | Yes | Native + external |
| Base | Minimal native token | Shared with Coinbase | Limited | Multiple |
Practical Checklist for Sustainable Models
- Verify that emission schedules scale proportionally with actual network usage growth.
- Confirm fee burn mechanisms are active and effectively reduce long-term supply pressure.
- Evaluate bridge security through recent audit reports and historical incident tracking.
- Review governance participation rates by analyzing onchain voting volumes and quorum achievement.
- Assess validator decentralization by measuring the Nakamoto coefficient and stake distribution.
- Compare sequencer revenue retention versus redistribution to token holders and ecosystem funds.
- Monitor liquidity depth across bridges to ensure users can exit without significant slippage.
- Cross-check token unlock calendars against current circulating supply to anticipate dilution events.
Common Pitfalls and How to Avoid Them
Analysts frequently overlook off-chain sequencer control or misinterpret bridge TVL as purely organic. Always verify data across multiple independent sources rather than relying on a single dashboard. Another common error involves ignoring vesting schedules that could flood the market. Combine quantitative onchain metrics with qualitative reviews of project roadmaps and governance proposals. Resources such as L2Beat, DeFiLlama, and Dune Analytics provide complementary views that reduce blind spots.
FAQs
How do I start onchain analysis without advanced coding skills?
Begin with pre-built dashboards on Dune Analytics and L2Beat, then gradually customize queries using their visual interfaces and community templates.
What indicates an unsustainable L2 token model?
Persistent high emissions without corresponding usage growth, concentrated sequencer ownership, and low governance participation are strong warning signs.
Can bridge metrics reliably predict token price movements?
They offer valuable liquidity health indicators but should be combined with revenue trends, staking data, and supply dynamics for a complete assessment.
How often should analysts refresh their L2 tokenomics reviews?
Perform comprehensive reviews monthly while monitoring key dashboards weekly to catch sudden shifts in revenue or staking patterns.
Which tools are most reliable for 2026 L2 data?
Combine L2Beat for scaling metrics, Dune for custom queries, DeFiLlama for liquidity, and official block explorers for raw transaction verification.
Conclusion
Applying these onchain analytics methods enables thorough evaluation of L2 tokenomics in 2026. Consistent use of the outlined workflows, checklists, and cross-referenced data sources empowers analysts to distinguish robust, sustainable models from those carrying hidden risks. Regular practice with real examples builds expertise that supports informed decision-making in the evolving Layer 2 landscape.

No comments yet. Be the first!