 CryptoChain Blog

Introduction to DePIN Tokenomics in 2026
Decentralized Physical Infrastructure Networks (DePIN) have matured significantly by 2026, blending blockchain incentives with real-world hardware deployments. Onchain analytics now serve as the primary lens for evaluating token sustainability, moving beyond surface-level metrics to reveal incentive alignments and economic resilience. Advanced practitioners rely on detailed blockchain data to assess whether token models can withstand scaling pressures, market volatility, and shifts in physical infrastructure demand. This guide delivers actionable frameworks for auditing participation rates, reward mechanisms, and supply dynamics, supported by concrete case examples and cross-sector comparisons that go far beyond basic overviews.
By 2026, DePIN projects span wireless connectivity, decentralized storage, energy grids, and sensor networks. Each sector presents unique tokenomics challenges that require tailored onchain scrutiny. Readers will learn how to query transaction histories, interpret node contribution data, and identify misalignments before they erode network value. The focus remains on practical, repeatable steps that advanced users can apply immediately to their own analyses.
Core Onchain Metrics for DePIN Evaluation
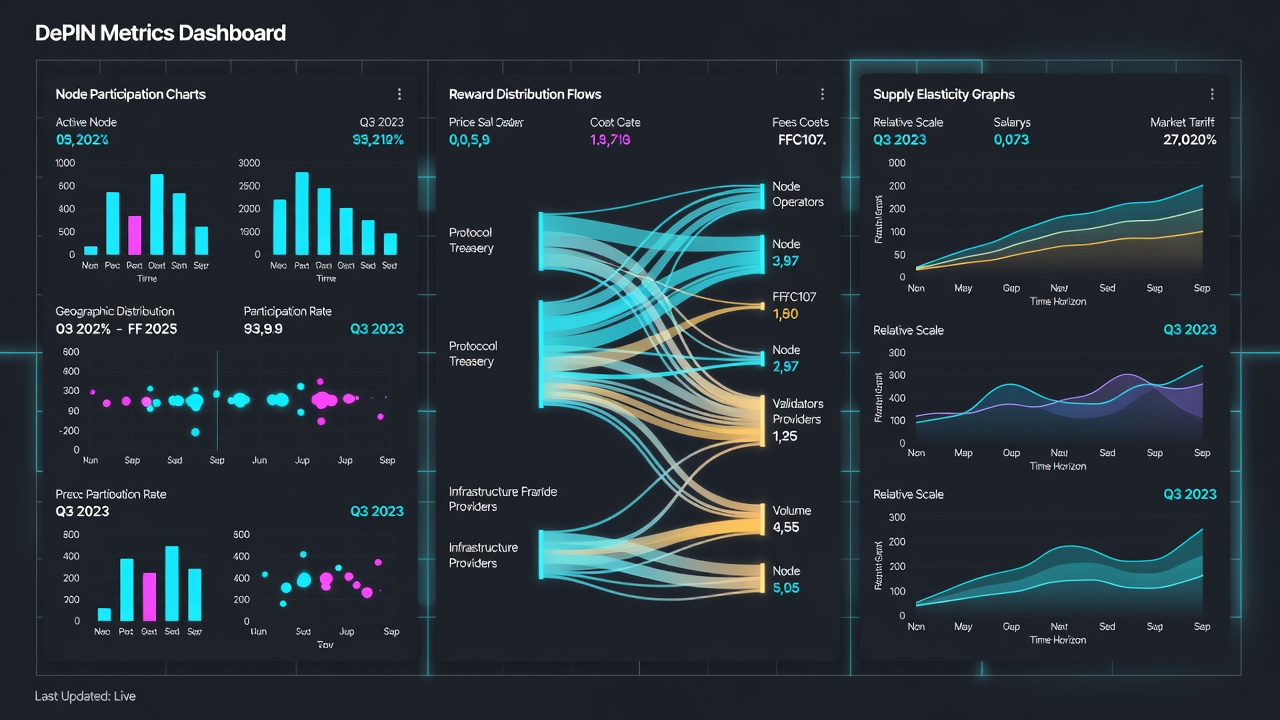
Effective tokenomics analysis begins with three foundational metrics that practitioners track across multiple chains. Node participation rates measure active hardware contributors relative to total registered nodes, often calculated by parsing smart contract events that log device registrations and heartbeat signals. Reward distribution flows track token emissions to operators versus stakers or protocol treasuries, revealing whether incentives favor long-term contributors or short-term speculators. Supply elasticity examines how token minting and burning mechanisms respond to network demand, typically measured through circulating supply changes correlated with usage volume.
Practitioners query indexing services and node APIs to aggregate these data points. For example, monitoring daily active nodes against reward claims highlights centralization risks when participation concentrates among a few large operators. Additional layers include analyzing staking ratios, slashing events, and delegation patterns that indicate operator commitment. These metrics together form a dashboard for early detection of unsustainable emission schedules or reward cliffs that could trigger mass exits.
Auditing Real-World Asset Integrations
DePIN projects increasingly integrate real-world assets (RWAs) such as sensors, wireless hotspots, and storage devices. Onchain audits verify that physical contributions map accurately to token incentives. Key steps include reviewing oracle feeds for data integrity, examining collateralization ratios for hardware-backed tokens, and tracing revenue streams from end users back to node operators. Practitioners also examine multi-signature treasury transactions to ensure protocol fees do not disproportionately benefit insiders.
Practical audits start with transaction graph analysis to confirm that usage fees flow directly into reward pools without excessive protocol leakage. Misalignments often appear as sudden spikes in treasury allocations unrelated to network growth or as oracle updates that lag behind real hardware performance. Tools for these audits include custom scripts that cross-reference onchain events with offchain telemetry logs provided by project teams.
Case Examples of Incentive Alignment
Consider wireless DePIN models where hotspot density directly influences coverage rewards. Onchain data reveals whether reward curves adjust dynamically to prevent over-saturation in urban areas while still incentivizing rural expansion. Storage-focused projects demonstrate supply elasticity through variable staking requirements tied to demand forecasts derived from onchain activity logs. Successful implementations show gradual emission tapering that matches actual data retrieval volumes.
Energy grid DePINs provide another lens, where token emissions correlate with verified kilowatt-hour contributions via IoT oracles. Onchain analysis in these cases tracks whether reward claims align with grid stability metrics and whether operators receive timely payouts that cover hardware depreciation. Cross-referencing these flows against external energy price indices helps confirm that token value remains anchored to real utility rather than pure speculation.
Comparing DePIN Models Across Sectors
- Wireless Networks: High node mobility requires flexible reward algorithms. Onchain analysis focuses on geographic participation heatmaps and latency-weighted rewards to optimize coverage without creating urban monopolies.
- Storage and Compute: Emphasis on uptime and latency metrics. Elasticity mechanisms often include dynamic slashing for underperformance and tiered rewards based on storage duration commitments.
- Energy and Sensor Grids: Revenue tied to external utility markets. Audits prioritize oracle accuracy, multi-chain bridging security, and verification of physical meter readings against onchain claims.
Optimization strategies involve stress-testing token models against simulated demand shocks using historical onchain datasets. Projects that incorporate feedback loops between usage metrics and emission schedules consistently demonstrate superior long-term retention and lower volatility in token price during network expansions.
Practical Steps to Conduct Onchain DePIN Analysis
Step one involves selecting reliable data sources such as public blockchain explorers and indexing protocols to pull raw transaction and event data. Step two requires building or using dashboards that visualize node activity trends over at least six months. Step three includes mapping physical device attestations to token flows through custom queries that filter for verified contributions. Step four entails scenario modeling where analysts adjust variables like reward rates or staking thresholds to predict future supply elasticity under different adoption curves.
Step five focuses on peer benchmarking across similar DePIN projects to identify relative strengths and weaknesses. Throughout this process, maintaining detailed audit logs ensures reproducibility and allows teams to refine models iteratively as new onchain data becomes available.
Common Pitfalls and FAQs
What are the most frequent tokenomics failures in DePIN?
Overly aggressive emission schedules that outpace actual usage growth often lead to inflationary pressure. Onchain monitoring of circulating supply versus active demand provides early warnings, allowing practitioners to flag projects before token value erodes significantly.
How can practitioners detect misaligned incentives?
Compare reward distribution ratios against node contribution data over multiple epochs. Large discrepancies between hardware deployment volume and token accrual signal design flaws that may require governance interventions or community proposals for correction.
Are multi-chain DePIN deployments more complex to analyze?
Yes, they require unified indexing across ecosystems, but they offer richer datasets for elasticity testing when properly aggregated. Cross-chain bridges must be audited for security and fee leakage to maintain accurate tokenomics pictures.
Conclusion
Mastering 2026 DePIN tokenomics demands rigorous onchain scrutiny of participation, flows, and elasticity. By applying these frameworks, practitioners can identify sustainable projects and refine incentive designs for maximum network efficiency. Continued evolution of analytics tooling will further enhance these capabilities across emerging sectors.
Further reading is available at ethereum.org, filecoin.io, and web3.foundation.

No comments yet. Be the first!