 CryptoChain Blog
Introduction to Memecoin Tokenomics in 2026
Memecoins have evolved from viral jokes into complex assets requiring rigorous onchain scrutiny. In 2026, investors rely on blockchain analytics to dissect token economics rather than hype alone. This guide details how to evaluate liquidity pools, track whale wallets, and interpret transaction velocity for informed decisions. The memecoin sector continues to attract significant capital flows, but success depends on understanding underlying data rather than social media momentum.
Understanding these elements helps distinguish projects with lasting potential from those prone to rapid collapse. Onchain data provides transparent, real-time insights unavailable through traditional finance channels. Analysts now integrate multiple data layers including smart contract interactions, holder concentration, and cross-chain bridging activity to build comprehensive risk profiles.
Key Onchain Metrics for Memecoin Analysis
Liquidity Pool Dynamics
Liquidity pools form the backbone of memecoin trading. Analysts examine pool depth, concentration of liquidity providers, and impermanent loss risks. Healthy pools show balanced inflows and minimal single-entity dominance. In practice, examining the ratio of locked versus unlocked liquidity reveals how committed early participants remain over time.
Tools like Dune Analytics dashboards reveal how liquidity locks and unlocks affect price stability. Sustainable models often feature locked liquidity for extended periods, reducing rug pull vulnerabilities. Additional factors include fee structures within automated market makers and how they influence trader retention during volatile periods.
Whale Wallet Movements
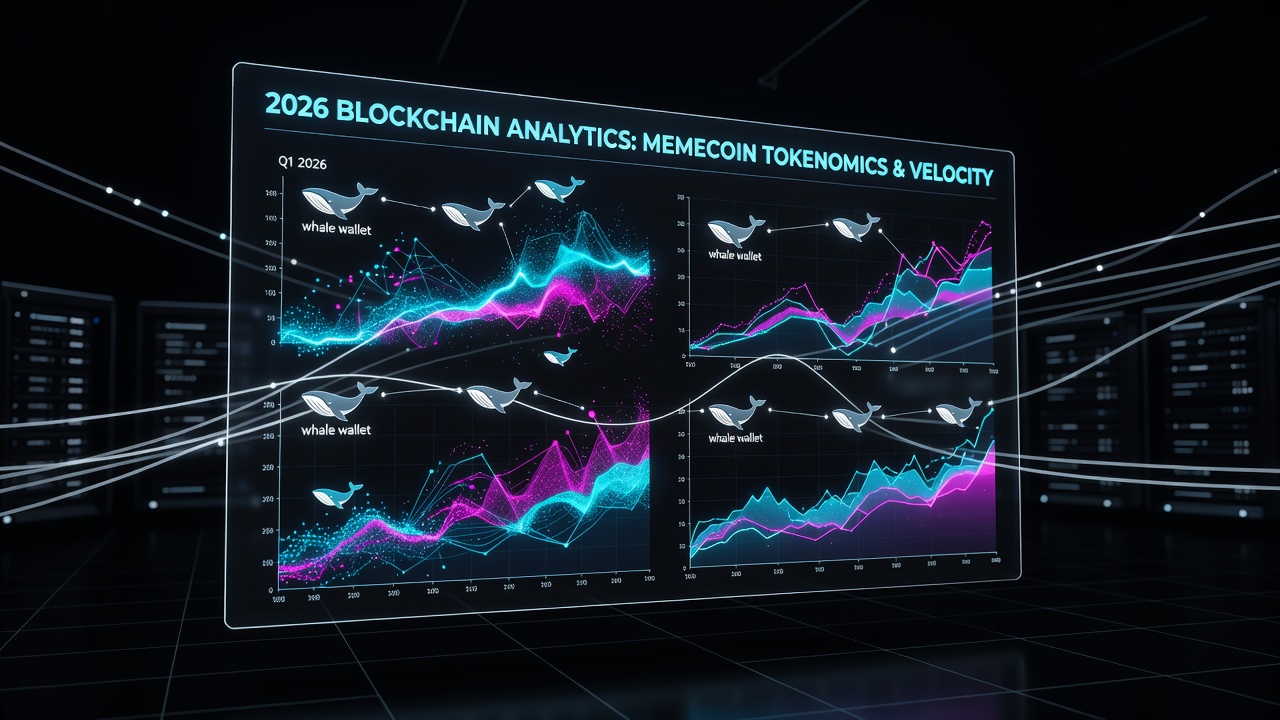
Whale activity signals potential market shifts. Monitoring large wallet transfers, accumulation phases, and distribution patterns offers early warnings. Clusters of wallets moving tokens to exchanges frequently precede sell-offs. Tracking wallet age and historical transaction patterns adds context, showing whether large holders are long-term believers or short-term speculators.
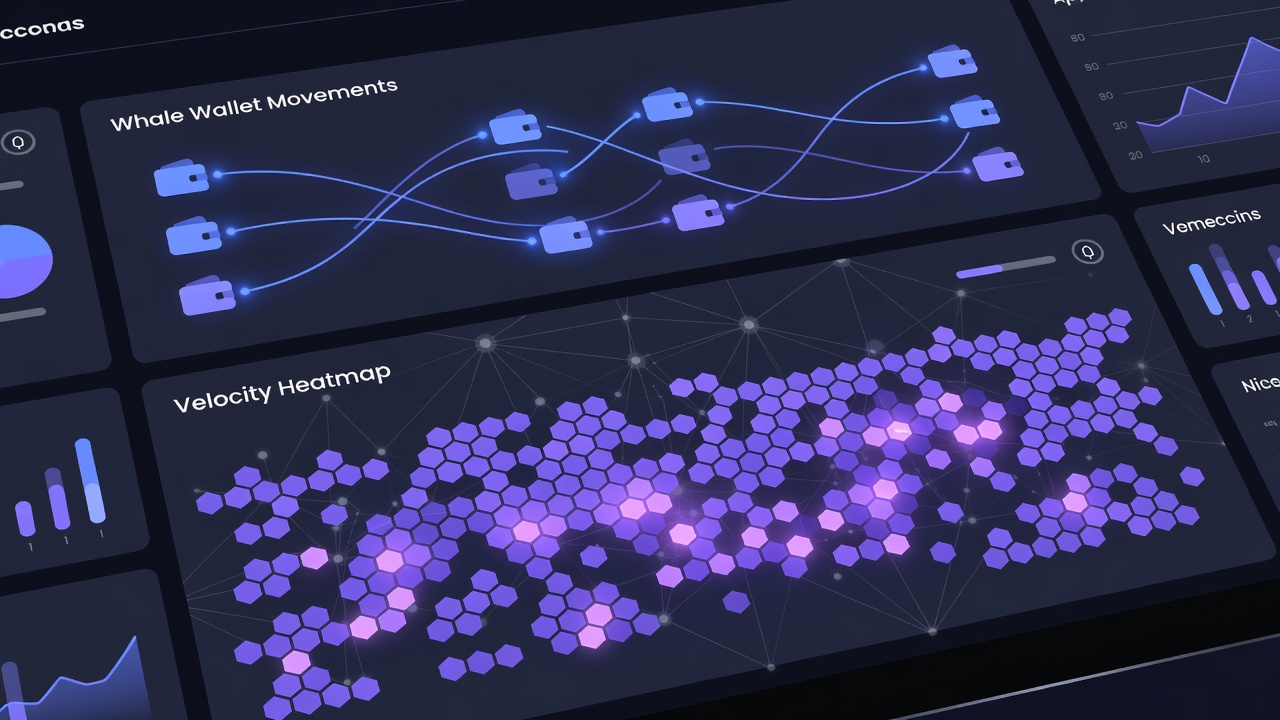
Step-by-step example: Start by identifying top holders via blockchain explorers, then track their historical behavior over 30-day windows. Compare against overall supply distribution for concentration risks. Advanced users combine this with exchange inflow data to anticipate liquidity shocks.
Transaction Velocity Patterns
Velocity measures how frequently tokens change hands. High velocity can indicate speculative trading, while steady, moderate levels suggest organic usage. In 2026, analysts cross-reference velocity with holder growth rates. Patterns showing velocity spikes without corresponding holder increases often flag artificial pumps driven by coordinated activity.
Further analysis involves segmenting velocity by wallet size cohorts. Retail-driven velocity tends to correlate with social volume, whereas whale-driven spikes may signal distribution phases. This layered approach provides clearer signals than aggregate numbers alone.
Step-by-Step Analysis Examples from Leading Memecoins
Consider a typical Solana-based memecoin. First, query pool creation data on-chain. Next, map holder distribution across time. Finally, overlay velocity metrics to assess sustainability. One recent case involved a community token that maintained steady velocity despite price corrections, indicating genuine usage rather than pure speculation.
Comparisons reveal that hype-driven tokens exhibit erratic whale movements and high velocity without utility growth, whereas sustainable ones demonstrate gradual distribution and consistent liquidity provisioning. Another example on Ethereum showed a memecoin with multi-month locked liquidity and transparent burn events, resulting in healthier holder retention compared to peers with unlocked pools.
Expanding on these, analysts often review contract upgrade history and proxy implementations to detect potential hidden functions that could alter supply dynamics unexpectedly.
Sustainable vs Hype-Driven Token Models
Sustainable memecoins prioritize transparent token allocation, community governance elements, and verifiable burns. Hype-driven counterparts rely on celebrity endorsements and rapid marketing cycles. The difference becomes evident when examining treasury management and whether funds support ongoing development or merely promotional campaigns.
Key differentiators include locked liquidity percentages and multi-sig treasury controls. Onchain verification of these features provides concrete evidence beyond whitepaper claims. Sustainable projects typically publish regular treasury reports and allow community veto on major decisions, fostering long-term alignment.
Risk Indicators Detectable via Blockchain Analytics
Common red flags include sudden liquidity removals, anonymous team wallets accumulating large stakes, and velocity anomalies tied to single addresses. Tools can flag these in real time. Additional indicators involve unusual bridging activity that moves large portions of supply to less transparent chains without clear rationale.
Practical tips: Set alerts for large transfers, review contract source code for hidden mint functions, and monitor social sentiment correlation with onchain flows. Combining these signals with time-series analysis of holder counts helps filter noise from genuine threats.
Practical Investor Tips for 2026
- Always verify liquidity lock status through official explorers before entry.
- Track top 100 holders weekly to detect distribution trends.
- Use velocity ratios alongside holder retention metrics for holistic views.
- Cross-reference multiple chains when memecoins bridge ecosystems.
- Review historical smart contract interactions for patterns of developer selling during price rallies.
- Monitor governance proposal participation rates as an indicator of active community involvement.
Conclusion
Effective memecoin evaluation in 2026 demands a data-first approach. By mastering liquidity dynamics, whale tracking, and velocity analysis, investors can navigate the space with greater confidence. Continuous learning and tool proficiency remain essential as the ecosystem matures.
FAQ: Spotting Rug Pulls and Long-Term Viability
How can onchain data reveal a potential rug pull?
Look for unlocked liquidity paired with developer wallet activity or sudden pool drains. These patterns often precede total liquidity removal.
What signals indicate long-term viability?
Consistent holder growth, locked liquidity over 12 months, and organic transaction velocity without external hype point to stronger prospects.
Are there free tools for these analyses?
Public dashboards on platforms such as Dune and Solana provide accessible starting points for memecoin investigations.
How important is contract verification?
Verified contracts on explorers like Etherscan allow direct inspection of mint and ownership functions, reducing hidden risk exposure.
Can velocity alone predict success?
No single metric suffices. Velocity must be evaluated alongside holder distribution and liquidity metrics for accurate assessment.


No comments yet. Be the first!