 CryptoChain Blog
Stablecoin Velocity Tracking: 2026 Onchain Tokenomics Playbook
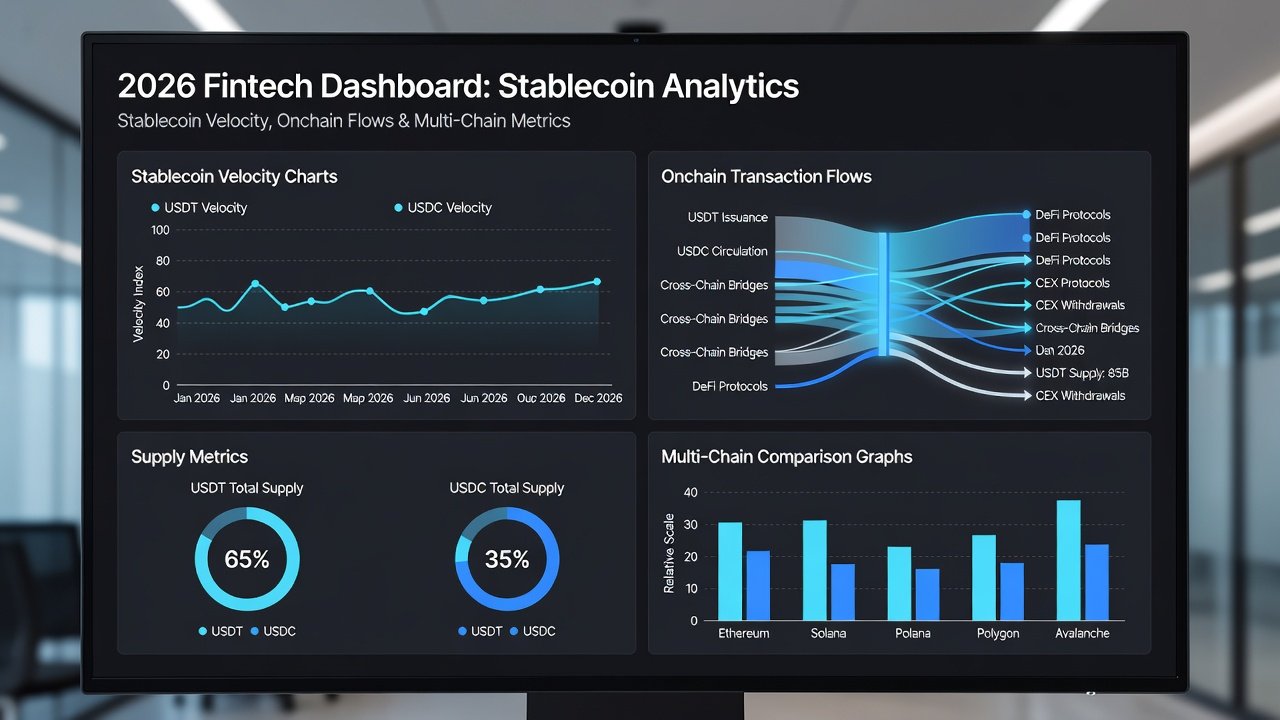
Stablecoin velocity serves as a foundational metric for evaluating how actively tokens circulate within decentralized finance ecosystems. In 2026, with maturing onchain infrastructure across multiple blockchains, analysts can now access granular data to track velocity with unprecedented precision. This playbook equips DeFi professionals with practical methods to monitor velocity using transaction volumes and supply figures, drawing from real examples involving USDT and USDC. By integrating reserve health comparisons, wallet cohort breakdowns, and cross-chain signals, readers gain tools to assess token sustainability and inform strategic decisions. The focus remains on concrete dashboards and case studies that deliver immediate value rather than abstract theory.
Understanding Stablecoin Velocity in 2026
Velocity quantifies the frequency of stablecoin usage by dividing aggregate transfer volumes by the average circulating supply over a defined interval. In the current landscape, factors such as regulatory clarity, institutional adoption, and layer-2 scaling solutions influence velocity patterns differently than in prior years. High velocity typically reflects vibrant economic activity including payments, trading pairs, and yield farming, whereas prolonged declines may point to accumulation phases or shifts toward competing assets. Understanding these dynamics helps analysts distinguish between healthy circulation and potential liquidity stagnation.
Step-by-Step Velocity Calculation Using Onchain Data
Accurate velocity computation begins with sourcing verified onchain datasets. Start by identifying primary contract addresses for the stablecoin under review and pulling daily transfer volumes from indexed blockchain data providers. Next, calculate the average supply by averaging daily outstanding token figures across the observation window, commonly set at 30, 60, or 90 days to smooth volatility. Apply the core formula: Velocity equals total transfer volume divided by average supply. To refine results, exclude internal exchange movements and known mixer addresses while weighting unique active wallets. Analysts should segment calculations by individual chains such as Ethereum, Tron, and Solana to uncover localized usage trends. Timeframe selection matters; shorter windows capture acute events while longer periods reveal structural shifts. Repeat the process weekly to maintain current dashboards that flag deviations from historical baselines.
Advanced practitioners incorporate volume filters for bot activity and normalize figures against total value locked in associated protocols. This layered approach prevents overestimation and produces decision-ready metrics.
Real-World Case Studies: USDT and USDC Flows
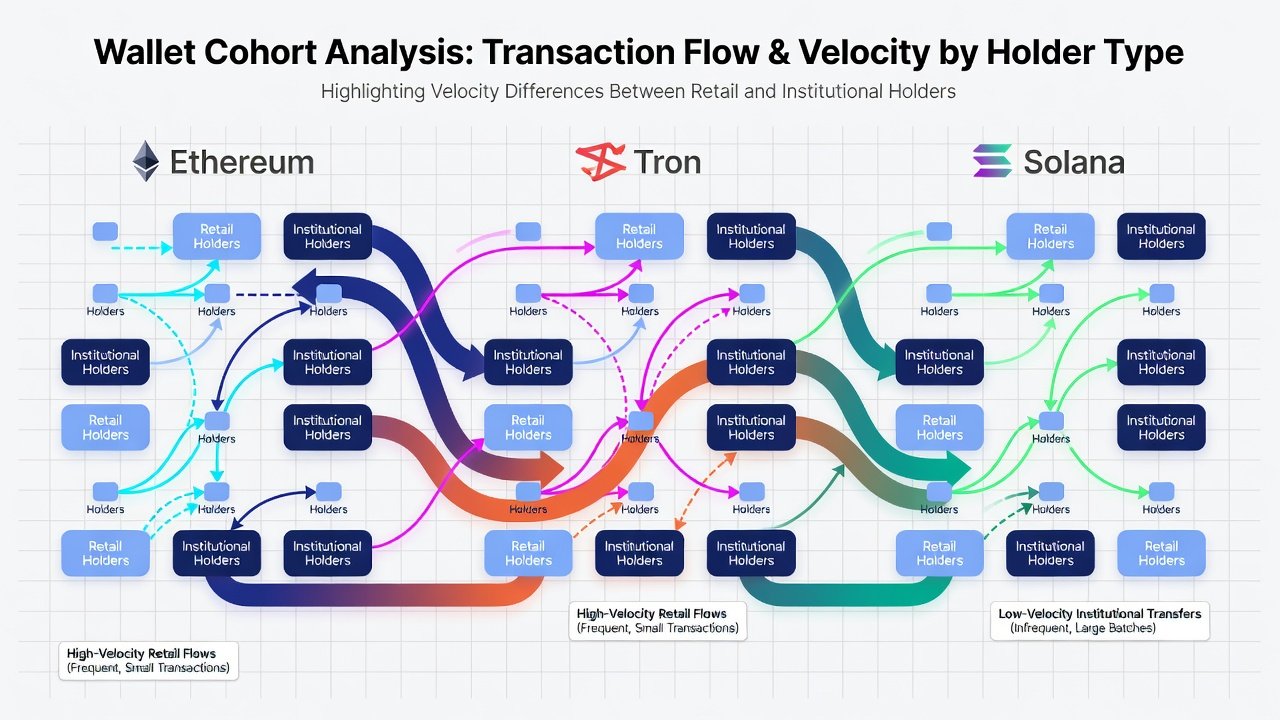
USDT demonstrates elevated velocity driven by its prevalence in emerging-market remittances and perpetual futures markets. Recent Tron-based flows illustrate spikes during regional payment cycles, with velocity metrics rising notably when cross-border volumes increased. In contrast, USDC maintains more moderate velocity levels tied to institutional treasury operations and regulated on-ramps. Case analysis of 2026 data shows USDC velocity remaining stable even amid broader market fluctuations, underscoring its reserve-backed resilience. These examples highlight how velocity divergences between the two assets can signal differing user bases and risk profiles. Analysts reviewing side-by-side dashboards quickly identify when one stablecoin’s circulation accelerates relative to supply growth.
Comparing Velocity Against Reserve Health Indicators
Reserve attestations provide essential context for velocity interpretation. When velocity rises alongside transparent, high-quality reserves, the pattern supports sustainable expansion. Conversely, velocity surges coinciding with reserve composition changes warrant closer scrutiny. In 2026, issuers publish monthly attestations that analysts cross-reference with velocity charts to detect early warning signs. This comparative method strengthens risk assessments for lending protocols and liquidity pools.
Wallet Cohort Analysis for Deeper Insights
Segmenting velocity by holder size reveals nuanced behavioral patterns. Retail wallets holding under 10,000 tokens frequently contribute to payment-driven velocity, while mid-tier DeFi participants drive activity through yield strategies. Large institutional addresses exhibit lower turnover, often functioning as long-term stores. Tracking cohort migration over multiple quarters allows detection of retail adoption growth or institutional rotation. Practical implementation involves labeling address clusters via clustering algorithms and recalculating velocity per segment.
Cross-Chain Movement Signals
Bridge inflows and outflows generate powerful velocity signals. A velocity contraction on Ethereum accompanied by supply expansion on Solana may indicate strategic reallocation rather than genuine demand reduction. Monitoring these flows through aggregated dashboards helps distinguish migration effects from organic usage changes. In 2026, increased interoperability heightens the importance of multi-chain velocity aggregation.
Recommended Tools for Ongoing Tracking
Effective monitoring relies on established platforms. DefiLlama supplies ready-made stablecoin dashboards with velocity overlays. Dune Analytics enables custom SQL queries for tailored cohort and chain views. Issuer portals at Tether and Circle deliver authoritative supply updates. Configure automated alerts within these tools to receive notifications when velocity crosses predefined thresholds.
Actionable Insights for DeFi Analysts
Integrate velocity data into portfolio construction by favoring assets with consistent circulation when building liquidity positions. Declining velocity in one stablecoin may prompt rebalancing toward higher-velocity alternatives. Combine velocity readings with TVL and reserve metrics to form comprehensive tokenomics evaluations that guide protocol participation decisions.
Mistakes to Avoid When Interpreting Velocity
- Overlooking chain-specific distortions that skew aggregate calculations.
- Neglecting to filter wash trading or automated bot flows before analysis.
- Ignoring seasonal market cycles that temporarily alter velocity baselines.
- Comparing velocity across assets without adjusting for differing use cases and user demographics.
FAQ: Interpreting Velocity Drops for Token Sustainability
What does a sudden velocity drop indicate?
A sharp decline often reflects reduced transactional demand, increased holding behavior, or migration to alternative stablecoins. Cross-reference supply trends and cohort movements to determine whether the change signals temporary rotation or structural weakness.
How often should velocity be recalculated?
Weekly updates provide sufficient granularity for routine monitoring, while daily recalculation becomes advisable during periods of elevated market volatility or regulatory announcements.
Can velocity predict reserve issues?
When paired with attestation data, sustained velocity drops can surface sustainability concerns ahead of redemption pressure, enabling proactive risk management.
How do cross-chain bridges affect velocity readings?
Bridge activity can temporarily inflate or deflate chain-specific velocity; always aggregate multi-chain data to obtain accurate ecosystem-wide perspectives.
Mastering these onchain techniques empowers analysts to evaluate stablecoin health with clarity and confidence throughout 2026’s dynamic tokenomics environment.


No comments yet. Be the first!