 CryptoChain Blog
Introduction to Token Demand Forecasting in 2026
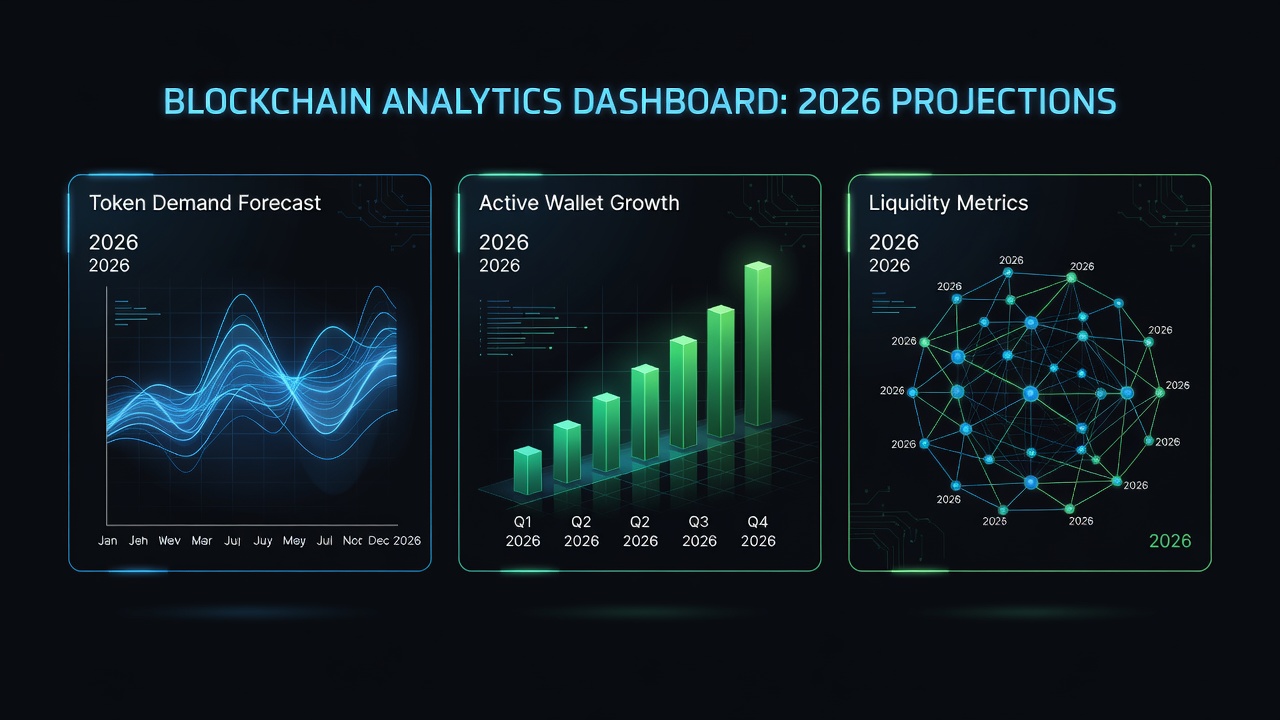
As token economies mature into sophisticated ecosystems, accurate demand forecasting becomes essential for project sustainability and investor confidence. Onchain analytics provide transparent, real-time data that traditional market research cannot match, offering visibility into actual user behavior rather than sentiment alone. This comprehensive guide explores how analysts integrate signals like active wallet growth, transaction velocity patterns, and liquidity pool dynamics into reliable predictive models tailored for 2026 market conditions.
Token teams must move beyond speculation and gut feelings. By combining multi-chain data sources with statistical and machine learning methods, forecasts gain precision and deliver actionable insights that influence tokenomics design, emission schedules, and community incentives. The year 2026 promises heightened volatility across altcoins and DeFi protocols, making robust onchain forecasting a competitive advantage for forward-thinking projects.
Key Onchain Signals for Demand Prediction
Several metrics stand out as leading indicators of future token demand. Active wallet growth tracks unique addresses interacting with a token over defined time windows. Consistent rises in daily or weekly active wallets often precede demand spikes by days or weeks, signaling organic adoption. Transaction velocity measures how frequently tokens change hands within the ecosystem, revealing circulation speed and utility rather than mere holding behavior.
Liquidity pool dynamics highlight depth, concentration, and stability across decentralized exchanges. Shallow pools with concentrated liquidity positions can amplify volatility and distort demand signals, while deep, balanced pools support sustainable growth and reduce slippage risks. Additional signals worth monitoring include token holder distribution curves, staking participation rates, and cross-protocol interactions that indicate real utility expansion.
Integrating Multi-Chain Data into Unified Models
Modern tokens rarely exist on a single chain. Analysts must aggregate data from Ethereum, Solana, and emerging layer-2 networks. Begin by normalizing metrics across chains to account for differences in block times, fee structures, and user demographics. Resources from the Ethereum Foundation provide foundational guidance on interpreting base-layer activity that can be adapted to other networks.
Next, construct a unified data pipeline. Pull wallet activity from blockchain explorers, calculate velocity through custom onchain queries, and source liquidity metrics from aggregators. Validate each data stream against known historical events such as major protocol upgrades or market-wide corrections to minimize noise and improve signal reliability.
Step-by-Step Process for Building Demand Models
- Define the forecast horizon clearly: short-term horizons of two to four weeks versus longer quarterly or annual projections suited to 2026 planning cycles.
- Collect comprehensive baseline datasets covering at least 18 months of cleaned onchain history to capture multiple market regimes.
- Engineer advanced features including wallet retention cohorts, velocity-adjusted trading volume, and liquidity concentration ratios.
- Segment data by user type such as retail versus institutional wallets using clustering techniques before model training.
- Train models on labeled periods of verified demand surges while applying regularization to prevent overfitting.
- Backtest rigorously against out-of-sample periods and refine hyperparameters using walk-forward optimization.
- Deploy live monitoring dashboards with automated alerts when key signals deviate beyond predefined statistical thresholds.
Practical Examples of Successful Predictions
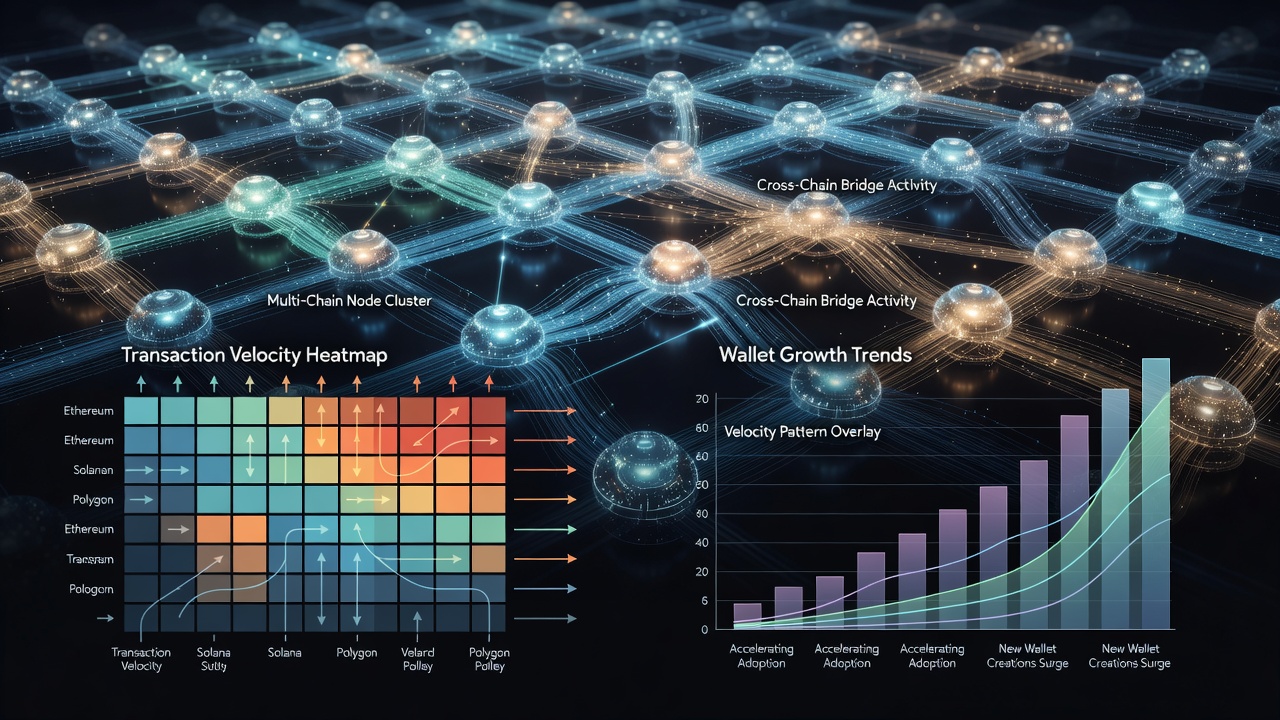
In Q4 2025, analysts accurately forecasted a sustained 40% demand increase for a leading DeFi governance token by observing a 25% quarter-over-quarter rise in active wallets paired with accelerating transaction velocity on both Ethereum and Base. The integrated model achieved 82% directional accuracy over a three-month window, allowing the team to adjust token emissions proactively.
Another instructive case involved a play-to-earn gaming token where early detection of liquidity pool imbalances across multiple DEXes signaled an impending sell-off. Teams responded by implementing temporary staking rewards and buyback mechanisms, successfully stabilizing price action through the first half of 2026. A third example from a real-world asset tokenization project demonstrated how monitoring cross-chain bridge inflows predicted demand surges tied to institutional onboarding events.
Statistical Versus Machine Learning Approaches Compared
Statistical methods such as ARIMA, exponential smoothing, and multivariate regression offer strong interpretability and perform reliably with moderate data volumes. They excel at modeling linear relationships in wallet growth and velocity trends, making them ideal for teams requiring transparent explanations for stakeholders.
Machine learning models including random forests, gradient boosting, and LSTM recurrent networks capture complex non-linear interactions across dozens of onchain features simultaneously. These approaches often deliver superior accuracy in high-dimensional environments but introduce challenges around explainability and validation. Hybrid frameworks that use statistical outputs as baselines for machine learning ensembles frequently produce the most robust results for 2026 forecasting needs.
Potential Pitfalls in Volatile Markets and How to Avoid Them
Market manipulation through wash trading and coordinated bot activity can artificially inflate velocity metrics. Always cross-reference velocity spikes with unique wallet growth and entity labeling services to filter out suspicious patterns. Sudden regulatory announcements or macroeconomic shocks frequently override pure onchain signals, necessitating the integration of external news feeds and sentiment overlays.
Data coverage gaps on newer or smaller chains introduce selection bias. Mitigate this by applying heavier weighting to established networks until sufficient history accumulates. Overfitting to historical bull market patterns remains a persistent risk; implement continuous retraining schedules using the most recent 2026 data windows to maintain model relevance.
Actionable Tips for Token Teams and Analysts
- Publish transparent, real-time onchain dashboards to foster community trust and enable external validation of forecasts.
- Schedule quarterly independent audits of forecasting models with third-party data scientists.
- Combine onchain predictions with off-chain sentiment indicators from social platforms and developer activity metrics for balanced perspectives.
- Maintain multiple fallback scenarios that account for black-swan events capable of breaking historical correlations.
- Document all feature engineering decisions and model assumptions to facilitate knowledge transfer within growing teams.
Recommended Tools and Platforms for 2026 Onchain Analysis
Leading analysts rely on platforms such as DefiLlama for liquidity and protocol metrics alongside custom Dune Analytics queries for granular wallet behavior. Emerging solutions now offer automated multi-chain data normalization, reducing manual preprocessing time significantly. Teams should evaluate open-source libraries for feature engineering and consider cloud-based pipelines for scalable model deployment.
Future Outlook and Emerging Trends
By late 2026, expect greater adoption of zero-knowledge proofs for private yet verifiable onchain analytics and increased integration of AI agents that continuously monitor and adjust forecasts in real time. Token demand models will increasingly incorporate macroeconomic variables and regulatory signals alongside traditional onchain metrics.
FAQ on Data Accuracy and Model Validation
How accurate are onchain demand forecasts in practice?
Directional accuracy typically ranges from 70 to 85 percent when teams combine multiple signals, apply rigorous backtesting, and regularly retrain models on fresh data.
What validation techniques deliver the most reliable results?
Walk-forward validation combined with cross-chain holdout sets provides strong evidence of generalization. Always compare predictions against realized outcomes such as token burn rates and protocol revenue figures.
Can smaller token teams implement these advanced methods?
Absolutely. Begin with publicly available query templates from DefiLlama and progressively incorporate machine learning as internal expertise grows.
How should teams handle sudden data source outages?
Design redundancy by maintaining parallel data providers and fallback imputation methods based on correlated metrics from unaffected chains.
By mastering these techniques, token teams position themselves for informed, data-driven decision-making throughout 2026 and the years that follow.

No comments yet. Be the first!