 CryptoChain Blog
Introduction to Tokenomics Stress Testing in 2026
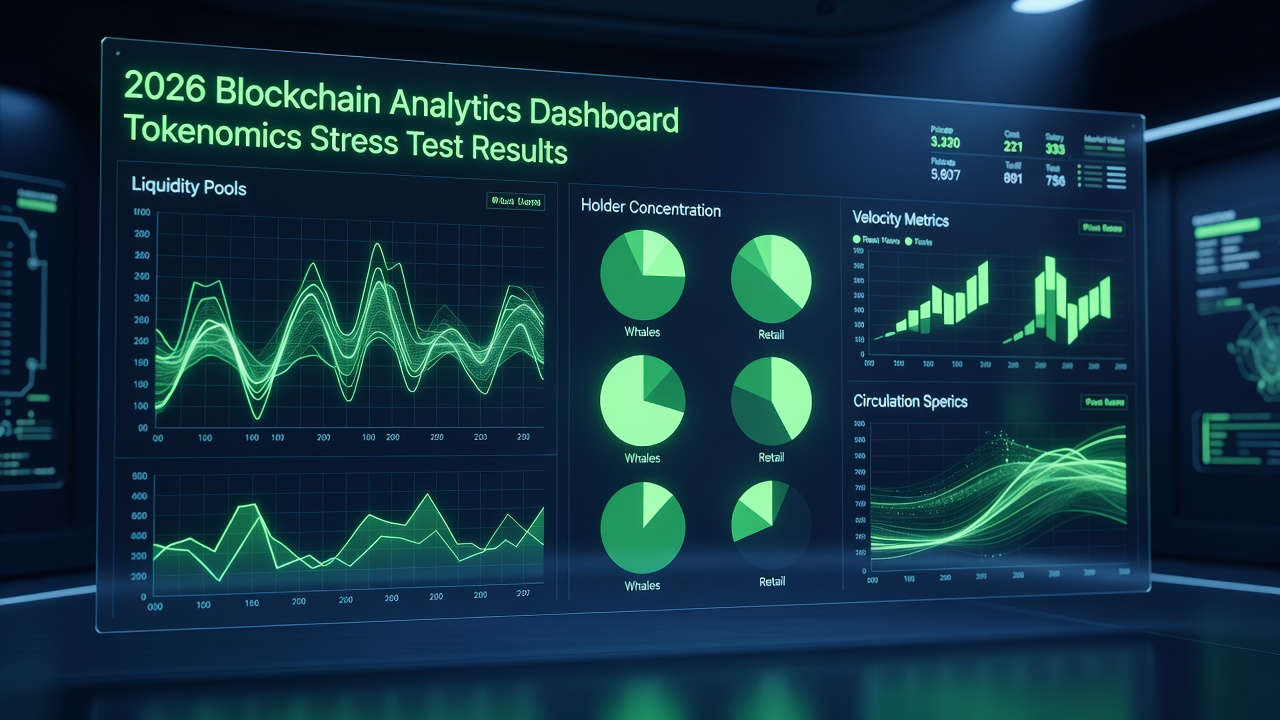
As blockchain ecosystems mature into complex financial infrastructures, understanding how token economies behave under pressure becomes essential for developers, investors, protocol teams, and even regulators. Tokenomics stress testing with onchain analytics allows practitioners to simulate extreme market conditions before they occur in reality, revealing hidden vulnerabilities in liquidity structures, token distribution patterns, and transaction velocity. This approach moves beyond static whitepaper models by leveraging live blockchain data to create dynamic, predictive scenarios that mirror real-world shocks such as flash crashes, regulatory announcements, or coordinated attacks on decentralized finance protocols.
This comprehensive guide provides a practical framework for building these tests using publicly available blockchain data from multiple networks. Readers will explore detailed step-by-step processes, concrete examples drawn from established DeFi protocols like automated market makers and lending platforms, as well as emerging layer-1 and layer-2 networks. The article also presents side-by-side comparisons of token designs that demonstrate resilience during simulated crises versus those that exhibit fragility, helping teams make informed decisions about incentive mechanisms and governance parameters.
Core Components of Tokenomics Stress Testing
Effective stress testing examines three primary interconnected areas: liquidity pool dynamics, holder concentration patterns, and velocity fluctuations. Because these elements interact dynamically, isolated analysis frequently misses systemic risks that only surface when multiple stressors combine simultaneously.
Liquidity Pool Simulations
Liquidity pools serve as the foundational infrastructure for decentralized exchanges and trading venues. Stress tests model sudden large-scale withdrawals, aggressive trading volumes, or external shocks that drain pool reserves. Analysts import historical onchain swap data and apply multipliers representing black-swan events, such as a sudden 10x surge in sell pressure or a rapid shift in stablecoin pegs. By replaying these scenarios across multiple chains, teams can identify minimum liquidity thresholds required to maintain acceptable slippage levels and prevent cascading liquidations.
Advanced simulations also incorporate cross-pool interactions, where draining one pool affects correlated assets in adjacent protocols. This reveals hidden dependencies that simple single-pool models overlook.
Holder Concentration Risks
High token concentration among a small number of wallets creates opportunities for manipulation and amplifies downside volatility. Stress testing tracks wallet clustering and balance changes over extended periods while simulating coordinated sell-offs by large holders or smart contract-based vesting schedules that unlock simultaneously. Key metrics include the Gini coefficient calculated from onchain token balances, the Herfindahl-Hirschman Index applied to circulating supply, and time-weighted distribution scores that account for staking or locking behaviors.
Protocols where the top ten holders control more than 40 percent of supply consistently demonstrate amplified downside pressure during simulated market shocks, often leading to rapid price discovery failures.
Velocity Fluctuations Under Extreme Scenarios
Token velocity measures the frequency with which individual units change hands within the ecosystem. During stress events, velocity can spike dramatically during panic selling or collapse when liquidity freezes and users withdraw from participation. Onchain analytics platforms track transfer counts, average holding periods, and staking participation rates to forecast these swings and their feedback effects on price stability.
Integrating velocity data with liquidity and concentration metrics produces composite risk scores that help prioritize mitigation strategies before deployment.
Essential Tools and Platforms for Onchain Analytics
Building robust stress-test models requires reliable data pipelines. Public indexers, node providers, and specialized analytics platforms supply raw transaction logs, decoded events, and labeled wallet clusters. Teams frequently combine multiple sources to cross-validate data and filter noise from exchange hot wallets or known market makers. Authoritative resources such as ethereum.org offer foundational documentation on data structures, while platforms like chainalysis.com provide advanced clustering and risk intelligence layers. Additional depth comes from integrating open datasets available through defillama.com for liquidity metrics across protocols.
Step-by-Step Process for Building Stress-Test Models
- Collect baseline onchain data spanning at least six to twelve months of transfers, swaps, staking actions, and governance votes to establish normal operating ranges.
- Define shock parameters including percentage of liquidity removed, number of large wallets exiting simultaneously, duration of the event, and secondary effects such as reduced staking participation.
- Run Monte Carlo simulations across thousands of iterations while logging price impact, recovery time, and downstream protocol health indicators.
- Compare simulation outputs against documented historical stress events on comparable protocols to calibrate model accuracy.
- Iterate parameters based on observed failure points and document threshold levels where the model indicates systemic breakdown.
- Generate automated reports that visualize risk surfaces and recommend parameter adjustments for governance proposals.
Thorough documentation of all assumptions ensures reproducibility and enables continuous refinement as new onchain data becomes available.
Real-World Examples from DeFi Protocols and Emerging Networks
One prominent automated market maker protocol conducted extensive stress testing in late 2025 and discovered that a 30 percent liquidity drain would push average slippage beyond acceptable thresholds within minutes. The findings prompted immediate adjustments to fee structures and the introduction of dynamic incentive programs that activate during high-volatility periods.
Emerging layer-1 networks have applied identical methodologies during token launch planning. One project identified that linear vesting schedules without cliffs created severe concentration risks, which only manifested when simulations combined sell pressure with simultaneous drops in staking participation rates. Another DeFi lending platform used velocity modeling to redesign its reward emissions, preventing a projected death spiral under extreme redemption scenarios.
These practical cases illustrate how proactive testing prevents post-launch crises and supports sustainable growth.
Resilient Versus Fragile Token Designs: Detailed Comparison
Resilient token designs incorporate broad holder distribution, dynamic liquidity incentives that scale with volatility, and velocity dampeners such as staking rewards that intensify during high-volume periods. Fragile designs, by contrast, rely heavily on a limited set of liquidity providers, feature linear vesting without protective cliffs, and lack mechanisms to counteract sudden velocity spikes.
Quantitative comparisons show that resilient tokens typically retain 60 to 80 percent of their value after simulated 50 percent market drawdowns, whereas fragile designs often lose more than 90 percent before any recovery phase begins. 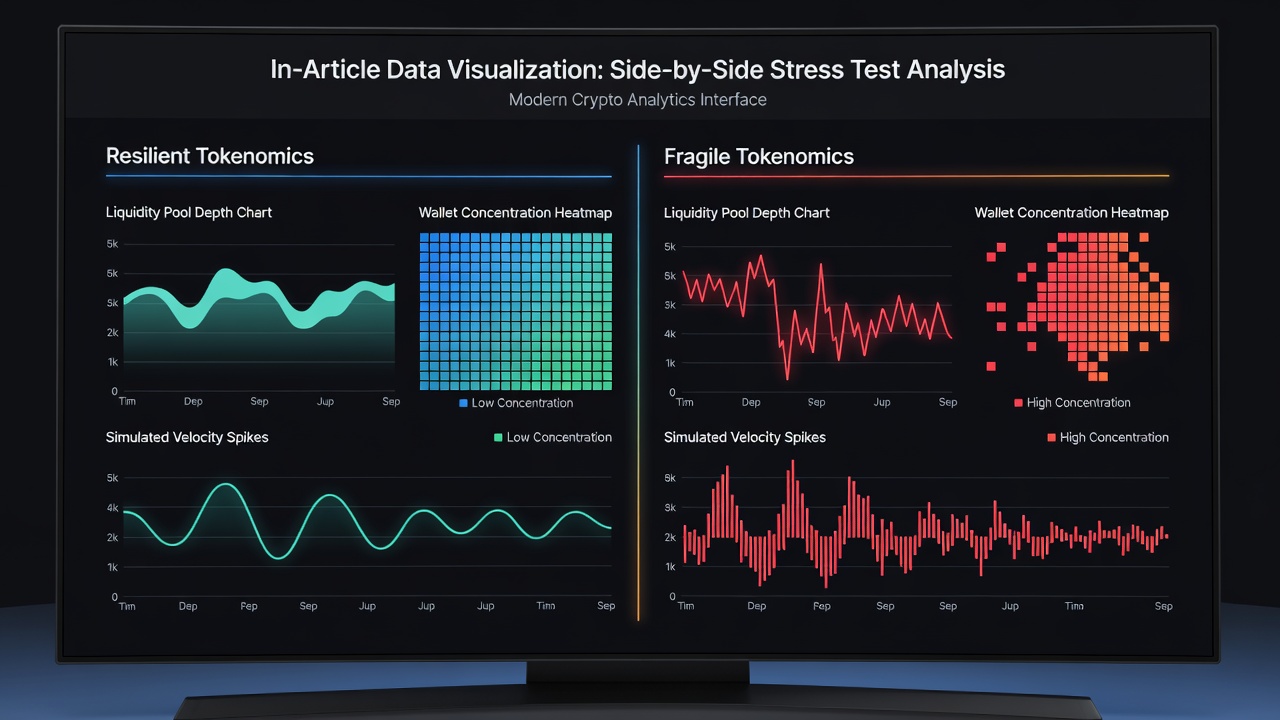
Advanced Techniques and Common Pitfalls to Avoid
Teams can enhance basic models by incorporating machine learning classifiers trained on historical onchain events to predict stress propagation paths. Another advanced approach involves multi-chain stress testing that accounts for bridge vulnerabilities and wrapped asset dynamics. Common pitfalls include over-reliance on single data sources, neglecting to model secondary effects like governance attacks, and failing to update parameters as protocol usage evolves. Regular model audits and community review processes help mitigate these issues.
Common Implementation Challenges and FAQ
How do teams access reliable onchain data for stress testing?
Public indexers and node providers deliver raw transaction logs. Analysts combine multiple sources to cross-validate wallet labels and remove noise from exchange-related activity.
What time horizon should stress tests cover?
Most practitioners model events lasting between 24 hours and 30 days, capturing both immediate shocks and medium-term recovery patterns.
Can stress testing replace traditional security audits?
No. Economic stress testing complements code-level audits by focusing on tokenomics rather than smart contract vulnerabilities. Using both approaches together delivers more complete protocol resilience.
How frequently should teams rerun stress tests?
Best practice involves quarterly reviews plus immediate re-testing after any major parameter change or significant onchain event such as a large token unlock.
Conclusion
Tokenomics stress testing with onchain analytics equips projects to anticipate and mitigate risks before market shocks materialize. By systematically examining liquidity dynamics, holder concentration, and velocity behaviors, teams can iterate toward designs that endure extreme conditions. As 2026 progresses, embedding these practices into regular governance workflows will distinguish sustainable protocols from those vulnerable to sudden failure. Continued learning through authoritative sources further strengthens implementation capabilities across the ecosystem.
No comments yet. Be the first!