 CryptoChain Blog

Introduction to Token Distribution Analysis in 2026
Understanding token distribution is essential for crypto analysts and project founders who want to evaluate true tokenomics beyond surface-level metrics. Onchain data provides transparent, verifiable insights into how tokens are allocated across wallets, enabling detection of concentration risks and tracking of distribution shifts over time. In 2026, advanced analytics platforms allow deeper examination of blockchain activity to inform investment decisions and protocol design. This approach goes far beyond simple circulating supply figures by revealing the actual behavior of holders, including exchanges, whales, team wallets, and retail participants. Analysts can now leverage real-time data from major chains such as Ethereum, Solana, and Base to build accurate pictures of token health.
This guide covers practical methods for analyzing token distribution using onchain tools, including wallet clustering techniques and real-world examples from live protocols. By the end, readers will have actionable frameworks for identifying both opportunities and red flags in any token ecosystem.
Why Token Distribution Matters for Tokenomics
Token distribution directly influences market stability, governance participation, and long-term project viability. Concentrated holdings can lead to volatility from large sell-offs, while broad distribution supports healthier ecosystems with organic growth. Onchain analysis reveals these patterns through public ledger data, offering advantages over traditional financial reports that often lack granularity. For instance, a project may claim fair launch status, yet onchain scrutiny frequently uncovers hidden allocations in a handful of addresses created shortly before launch.
Key Metrics Beyond Basic Supply
Focus on holder distribution percentiles, top wallet concentrations, and velocity of token movement. These metrics highlight whether a token is widely held or dominated by a few entities. Additional indicators include the percentage of supply locked in smart contracts, the ratio of active addresses to total holders, and changes in median holding size over multiple epochs. These data points help distinguish between genuine community ownership and artificial inflation from farming activities.
Essential Tools for Onchain Token Distribution Analysis
Several platforms provide the data infrastructure needed. Dune Analytics enables custom SQL queries on blockchain data for distribution dashboards. Etherscan offers basic token holder views and transaction histories on Ethereum-based assets. Additional powerful options include blockchain explorers for Solana and other ecosystems that allow export of holder snapshots at specific block heights.
Start by connecting to a blockchain explorer or analytics suite. Export holder lists and import into visualization tools for deeper review. Most professionals combine multiple sources to cross-verify data accuracy, especially when analyzing tokens that span several chains through bridges.
Step-by-Step: Wallet Clustering Techniques
Wallet clustering identifies addresses controlled by the same entity, preventing misinterpretation of distribution. Follow these steps:
- Collect transaction data from multiple addresses using onchain APIs and label known entities such as centralized exchanges or protocol treasuries.
- Apply heuristics such as common spending patterns, deposit timing to the same contracts, or shared funding sources to group wallets together.
- Validate clusters with known labels from intelligence platforms and manual review of large transactions.
- Recalculate effective holder counts after clustering to adjust concentration metrics and avoid double-counting.
- Document assumptions and revisit clusters periodically as new onchain behaviors emerge.
This process reduces noise from exchange hot wallets, mixer services, or automated market maker liquidity positions that can distort perceived decentralization.
Identifying Concentrated Holdings
Scan top-10 or top-100 holder lists for patterns indicating risk. Look for wallets holding over 5% of supply and monitor their activity for transfers to exchanges or sudden movements during high-volatility periods. Cross-reference these addresses against public disclosures from project teams or known venture capital funds. In practice, many protocols maintain multisig wallets for treasury funds that should be clearly labeled rather than hidden among anonymous holders.
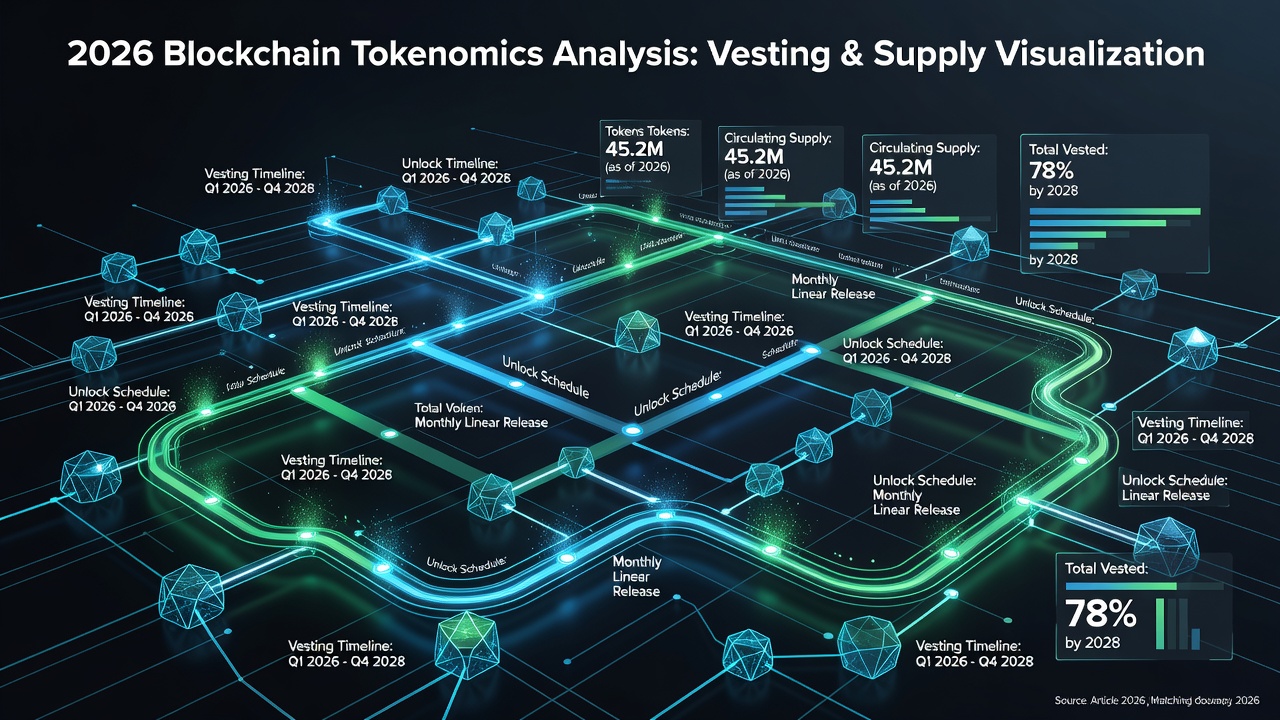
Compare against protocol treasuries or team allocations disclosed in documentation. Pay special attention to vesting contract addresses that release tokens gradually, as these can create predictable sell pressure when unlocks occur.
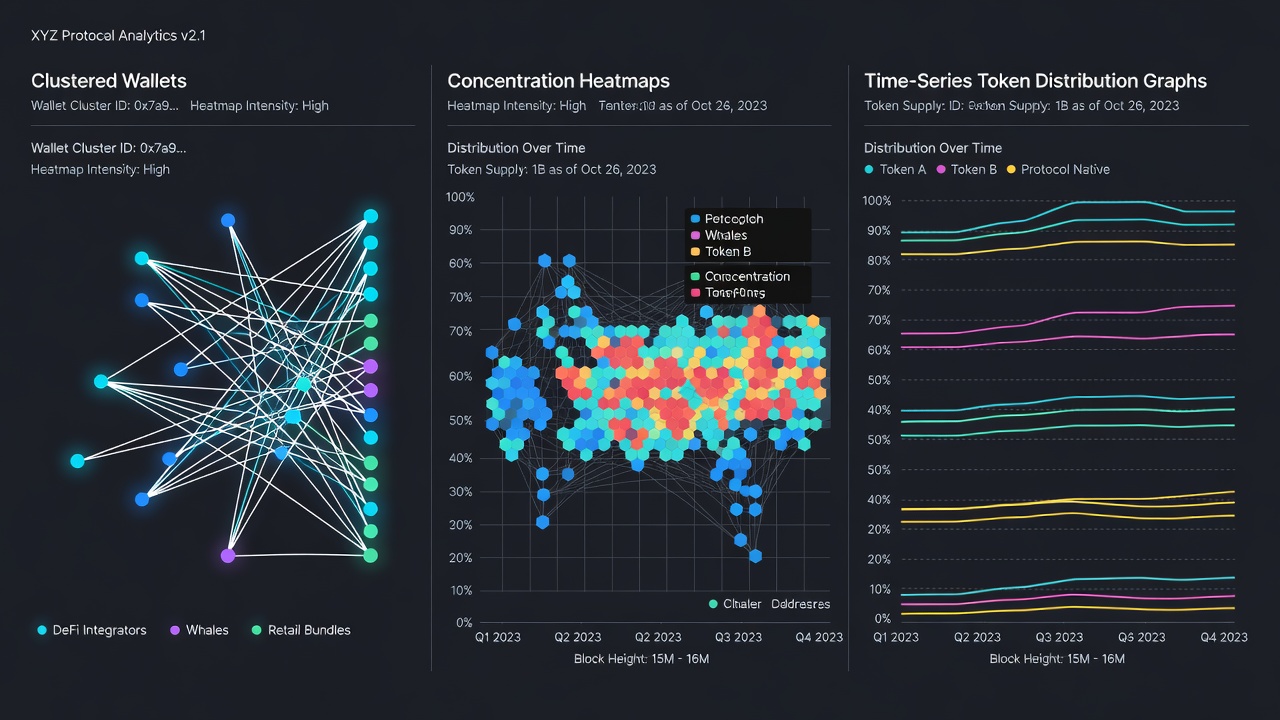
Tracking Distribution Changes Over Time
Use historical snapshots from blockchain data to build time-series views. Query daily holder distributions and plot Gini coefficients or Lorenz curves to quantify inequality trends. Analysts often examine data at key milestones such as token generation events, major unlocks, or governance votes to understand how ownership evolves. Real examples include monitoring post-TGE unlocks in major DeFi protocols, where initial concentration often decreases as vesting schedules progress and tokens reach broader markets through liquidity pools and airdrops.
Advanced users create automated alerts that trigger when the top 10 holders increase their combined share by more than 2% within a 7-day window, allowing rapid response to potential accumulation or distribution events.
Healthy vs Risky Distributions: Live Protocol Comparisons
Healthy distributions feature gradual holder growth, low top-wallet dominance under 20%, and consistent liquidity across decentralized exchanges. They typically show steady increases in unique active addresses and minimal correlation between large holder movements and price swings. Risky patterns show rapid accumulation in few addresses, frequent large transfers to centralized platforms, and minimal retail participation beyond airdrop hunters.
Protocols like established layer-1 networks demonstrate balanced metrics with diversified holder bases and transparent treasury management. In contrast, newer meme tokens frequently exhibit extreme concentration early on, with the top five wallets sometimes controlling over 60% of supply shortly after launch. Founders should aim for distribution curves that mirror successful projects rather than speculative assets.
Common Pitfalls and How to Avoid Them
Avoid relying solely on unadjusted holder counts, which can be inflated by airdrop farmers or bot activity. Always apply clustering and cross-reference with off-chain context where available. Another frequent mistake is ignoring bridged or wrapped versions of tokens that exist on secondary chains, leading to incomplete pictures of total supply distribution. Analysts should also watch for wash trading or artificial volume that masks true holder behavior.
Finally, never treat a single snapshot as definitive. Distribution is dynamic, and meaningful conclusions require multiple data points collected over weeks or months.
Conclusion
Effective token distribution analysis in 2026 requires combining robust onchain tools, careful clustering methods, and ongoing monitoring. By applying the frameworks outlined above, both analysts and founders can gain clearer visibility into tokenomics health and make more informed decisions. Regular practice with real blockchain data builds intuition for distinguishing sustainable projects from those carrying hidden concentration risks.
FAQ
How often should distribution analysis be performed?
Weekly reviews are recommended for active protocols, with deeper monthly audits incorporating clustering updates and cross-chain reconciliation.
What data sources are most reliable in 2026?
Public blockchain explorers combined with analytics platforms like Dune provide the most transparent and verifiable datasets for ongoing monitoring.
Can distribution analysis predict price movements?
It offers valuable risk signals but should be combined with broader market, fundamental, and sentiment analysis for any trading or investment decisions.
Is clustering always accurate?
Clustering relies on heuristics and can produce false positives or negatives, so results should be treated as probabilistic and validated against multiple data sources whenever possible.
No comments yet. Be the first!