 CryptoChain Blog

Introduction to Onchain Velocity in Tokenomics
Token velocity measures how frequently a cryptocurrency changes hands within a given period. In 2026, analyzing this metric onchain has become essential for assessing whether a token’s economic model supports long-term value retention. High velocity often signals speculative trading rather than utility, while low velocity can indicate strong holding behavior among users and stakeholders. Projects that ignore velocity risk building economies that erode quickly under market pressure, as rapid circulation can dilute scarcity signals and reduce incentives for long-term participation.
This analysis draws directly from public blockchain data to calculate turnover rates and distribution patterns. By quantifying velocity, projects can identify risks in their token design before they erode investor confidence. Onchain tools now allow anyone to access granular transaction histories, making velocity a transparent benchmark rather than an opaque internal metric.
Core Metrics: Turnover Rates and Holder Distribution
Turnover rate is calculated as total transaction volume divided by circulating supply over a defined timeframe. Holder distribution examines concentration among top wallets, revealing whether tokens are widely dispersed or held by a small group of addresses. These two metrics together provide a fuller picture than price charts alone. For instance, a token with low velocity but high concentration in a few wallets may still face sell-pressure risks during market stress, as large holders can trigger cascading effects even without frequent trading.
Additional layers include active address counts and age-of-coins metrics, which show how long tokens remain dormant before moving. Distribution patterns often correlate with governance participation rates, where broad ownership tends to stabilize decision-making processes.
Velocity Formulas Derived from Onchain Data
The standard velocity formula is V = T / M, where V is velocity, T represents total transaction volume, and M is the average money supply (typically circulating supply). Analysts refine this by filtering for unique addresses and excluding exchange hot wallets to focus on organic movement. Time-weighted variants adjust for periods of high activity, such as during token launches or major protocol upgrades, providing smoother trend lines.
Advanced models incorporate staking or locking mechanisms that reduce effective circulating supply. For example, subtracting locked tokens from the denominator yields an adjusted velocity that better reflects usable liquidity. These refinements help teams compare projects across different blockchain environments where native token mechanics vary significantly.
Step-by-Step Guide to Extracting and Calculating Velocity
- Identify the target blockchain and token contract address using a public explorer such as Etherscan.
- Export transaction volume data for the desired period, typically 30 or 90 days, while applying filters to remove internal contract interactions.
- Retrieve circulating supply figures from verified onchain sources and cross-reference with community dashboards.
- Apply the velocity formula and segment results by holder cohorts, such as whales versus retail addresses.
- Visualize patterns using analytics platforms to spot anomalies such as sudden spikes in transfer activity or clustering around specific events.
- Document assumptions and data-cleaning steps to ensure reproducibility for future audits.
Following these steps consistently allows teams to track velocity trends over multiple quarters and correlate changes with protocol updates or market events.
Data Sources and Recommended Analytics Platforms
Reliable velocity analysis depends on high-quality data feeds. Public explorers provide raw transaction logs, while specialized dashboards aggregate metrics across chains. Platforms like Dune Analytics enable custom queries that combine transfer volumes with supply data. Coin Metrics offers standardized onchain datasets suitable for institutional-grade calculations. DeFi-specific aggregators such as DefiLlama help contextualize velocity within broader ecosystem activity. Analysts should always validate data across at least two sources to minimize discrepancies caused by indexing delays or chain reorganizations.
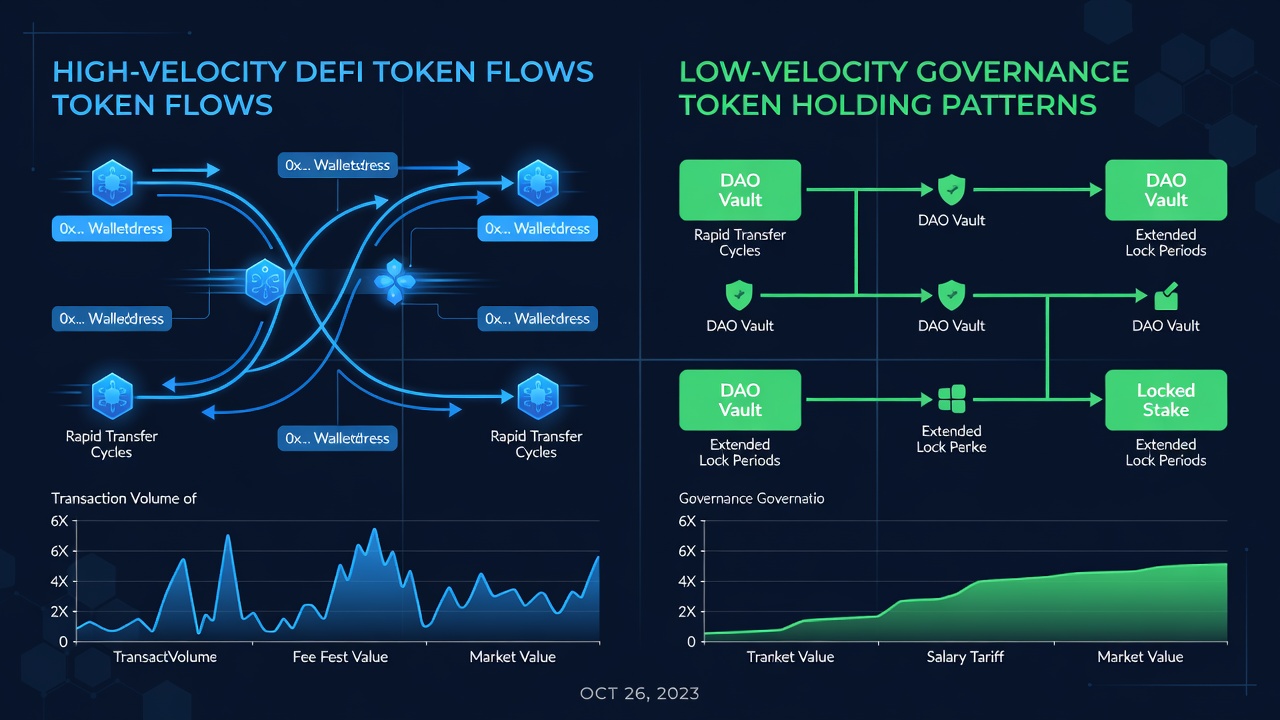
Case Study Comparisons: High-Velocity DeFi Tokens vs Low-Velocity Governance Assets
High-velocity DeFi tokens, such as those used in lending protocols, frequently show annual velocities exceeding 50x because users constantly swap, lend, and repay positions. This pattern suits utility-driven designs where the token facilitates repeated interactions. In contrast, governance tokens from established DAOs often maintain velocities below 5x, reflecting long-term holding for voting rights and treasury oversight.
Comparing these reveals clear design implications. One lending protocol token demonstrated velocity spikes during incentive campaigns, followed by rapid declines once rewards ended, highlighting the need for sustainable utility beyond temporary boosts. Governance assets, meanwhile, benefited from vesting schedules that aligned holder incentives with multi-year roadmaps. These case studies illustrate how velocity serves as a leading indicator for whether tokenomics encourage speculation or productive use.
Advanced Analysis Techniques
Beyond basic formulas, analysts apply cohort analysis to track velocity within specific holder groups. Segmenting by wallet age or transaction size uncovers hidden behaviors, such as early investors rotating holdings versus new users accumulating for utility. Network effects can also be modeled by correlating velocity with active user growth rates. When velocity rises alongside user growth, it often signals healthy adoption; when velocity rises while users stagnate, it may indicate wash trading or artificial volume.
Practical Implications for Token Redesign
Projects can lower excessive velocity by introducing staking rewards, vesting schedules, or utility features that reward holding. Conversely, protocols seeking higher engagement may add incentives for active participation such as fee-sharing or liquidity mining. Regular velocity monitoring helps teams iterate on tokenomics before imbalances become structural problems. Redesign efforts should include simulation modeling to predict how proposed changes affect velocity under different market scenarios. Teams that publish transparent velocity reports alongside quarterly updates tend to build greater community trust and attract long-term capital.
Common Analysis Pitfalls and How to Avoid Them
- Overlooking exchange flows that distort organic velocity readings; always tag and exclude known custodial addresses.
- Using raw transaction counts without deduplicating internal contract calls, which inflates volume artificially.
- Ignoring network-specific factors like gas fees that influence transfer frequency on high-cost chains.
- Applying formulas across incompatible timeframes without normalization, leading to misleading trend comparisons.
- Failing to account for bridged or wrapped token versions that fragment supply across multiple chains.
Avoiding these pitfalls requires disciplined data hygiene and periodic peer review of analytical methods.
Frequently Asked Questions
What is a healthy velocity range for most tokens?
Most sustainable projects target velocities between 2x and 12x annually, depending on their use case. Governance-focused assets trend lower, while payment or DeFi tokens can sustain higher figures when utility demands frequent circulation.
How often should teams recalculate velocity?
Monthly reviews are standard, with deeper quarterly audits that incorporate holder distribution trends and macroeconomic conditions. Major protocol changes warrant immediate recalculation to assess impact.
Can velocity be manipulated?
Yes, wash trading and bot activity can inflate figures. Analysts mitigate this by filtering known exchange addresses and applying statistical outlier detection methods.
Should velocity be the sole metric for evaluating tokenomics?
No. Velocity works best alongside metrics such as holder retention, staking ratios, and real usage data to form a complete sustainability assessment.
Conclusion
Onchain velocity analysis offers a data-driven lens for evaluating token sustainability. By combining turnover metrics, holder patterns, and careful calculation, teams and investors gain actionable insights that support more resilient token economies in 2026 and beyond. Regular application of these methods helps separate durable projects from those built on fragile assumptions, ultimately contributing to healthier blockchain ecosystems overall.

No comments yet. Be the first!