 CryptoChain Blog

Introduction to Metaverse Tokenomics in 2026
The metaverse continues to evolve rapidly in 2026, with virtual economies driven by complex token systems. Onchain analytics provides the transparency needed to evaluate sustainable token economics. This case study breaks down how blockchain data reveals utility token flows, liquidity pool health, and distribution patterns, helping investors sidestep common issues like inflationary pressures. As virtual worlds integrate deeper with decentralized finance, understanding these dynamics becomes critical for participants seeking long-term value rather than short-term speculation.
Understanding these metrics is essential for long-term viability. Projects that maintain balanced tokenomics demonstrate resilience through transparent onchain activity. In an environment where thousands of tokens compete for attention, data-driven insights separate viable economies from those prone to collapse under their own emission schedules.
Key Components of Metaverse Token Economics
Metaverse tokens serve multiple roles including governance, access to virtual land, and in-world transactions. Onchain analysis tracks how these tokens move between wallets, smart contracts, and liquidity pools. Each component interacts with others to create either virtuous cycles of adoption or vicious cycles of dilution and abandonment.
Utility Token Flows
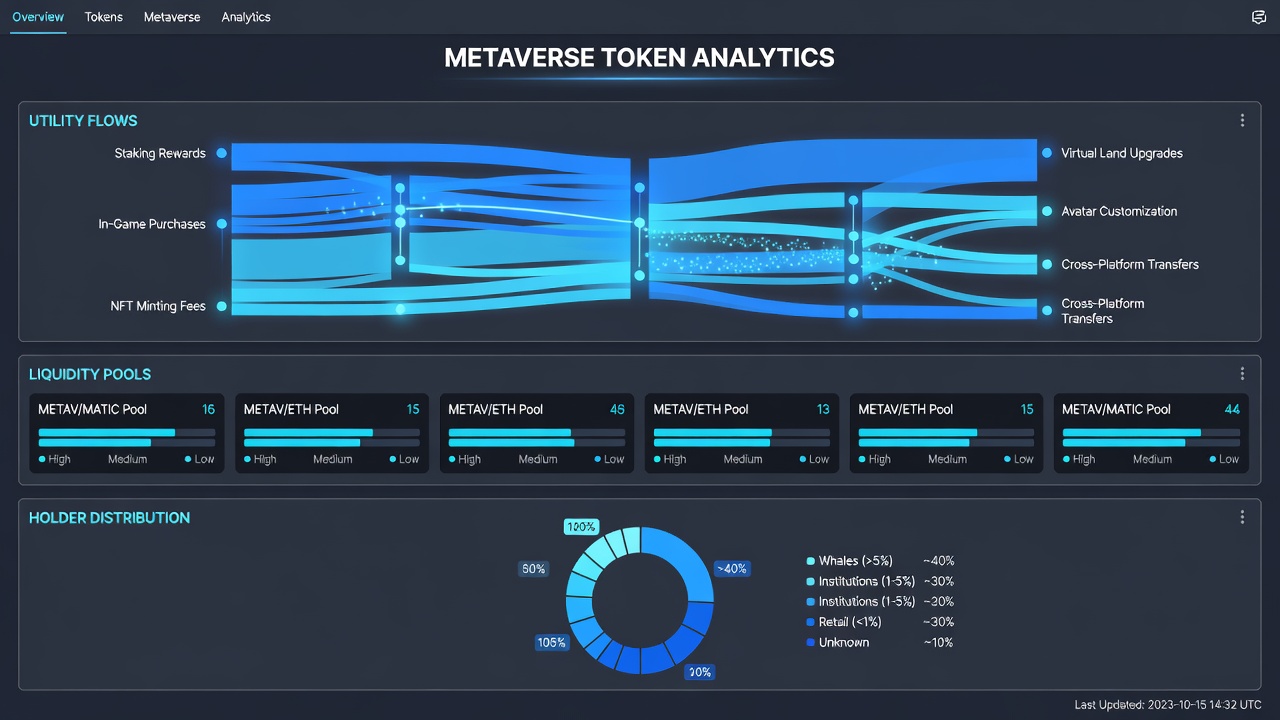
Utility tokens power daily interactions in virtual worlds. Analysts examine transaction volumes, velocity, and holding periods to assess real usage versus speculation. Tools like blockchain explorers reveal whether tokens circulate for genuine economic activity or remain hoarded. For instance, a healthy flow shows consistent transfers from user wallets to marketplace contracts for avatar upgrades or event tickets, indicating organic demand. Conversely, spikes in large transfers to exchange addresses often precede sell pressure that undermines token value.
Velocity calculations help quantify this activity. By dividing the total number of token transfers by the average circulating supply over a given window, analysts can determine whether tokens function as a medium of exchange or simply as speculative assets. Projects with velocity rates that align with actual user engagement tend to sustain higher valuations over multiple market cycles.
Analyzing Liquidity Pool Health
Liquidity pools underpin trading and stability in metaverse ecosystems. Onchain metrics such as total value locked, impermanent loss exposure, and concentration of liquidity providers highlight risks. Healthy pools show diversified participation and consistent depth across trading pairs. Shallow pools with a handful of dominant providers can experience dramatic price swings when those providers withdraw funds during volatility.
Practical monitoring involves reviewing pool composition over time. Analysts look for signs of liquidity fragmentation across multiple decentralized exchanges and the presence of automated market maker incentives that encourage long-term provisioning rather than mercenary farming. DeFiLlama offers aggregated data on liquidity across protocols, enabling comparisons of pool resilience over time. Additional context comes from examining smart contract interactions that signal large-scale removals before they impact trading spreads.
Distribution Patterns Across Virtual Economies
Token distribution influences fairness and centralization risks. Onchain data maps allocations among founders, community treasuries, and public holders. Balanced distributions reduce the chance of large dumps that trigger inflation. When a small number of addresses control the majority of supply, even modest selling can overwhelm demand and create downward spirals that erode community trust.
Distribution analysis often includes reviewing vesting schedules encoded in smart contracts and comparing unlock events against historical price reactions. Transparent projects publish these schedules onchain, allowing anyone to anticipate potential supply shocks and adjust positions accordingly.
Step-by-Step Examples of Tracking Metrics
Effective onchain analysis follows a repeatable process that combines multiple data sources. Here is a practical workflow used by analysts in 2026:
- Identify the primary token contract address through official project documentation and verify it on a block explorer to confirm total supply and deployment details.
- Query holder distribution to identify concentration among top wallets, including team and treasury addresses, then track changes over weekly intervals.
- Monitor transaction velocity by aggregating transfer counts and comparing them against daily active addresses to distinguish between genuine usage and wash trading.
- Review liquidity pool contracts for withdrawal patterns, fee accrual rates, and provider concentration using dashboards that visualize impermanent loss exposure.
- Cross-reference governance proposals with onchain voting records to see whether token holders actively participate in decisions that affect emission rates.
- Generate historical snapshots at monthly intervals to detect gradual shifts toward centralization or unsustainable inflation before they become obvious in price charts.
This structured approach reduces reliance on narrative claims and grounds decisions in verifiable blockchain activity.
Comparisons Between Leading Metaverse Protocols
Decentraland and The Sandbox illustrate differing approaches. One protocol emphasizes land-based utility with steady onchain flows, while the other focuses on user-generated content driving higher transaction velocity. Onchain comparisons show variations in liquidity depth and holder retention rates. Additional protocols such as Otherside and Somnium Space demonstrate how land scarcity mechanics and cross-platform interoperability affect token circulation patterns.
Investors benefit from cross-protocol analysis to identify which models sustain value better amid market cycles. For example, protocols that tie token utility directly to recurring virtual events tend to exhibit more stable velocity than those relying solely on one-time land sales.
Avoiding Common Pitfalls Like Inflationary Pressures
Many projects suffer from unchecked token emissions. Onchain monitoring flags rising supply without corresponding demand. Sustainable designs incorporate burn mechanisms or usage-based sinks that offset new issuance. Common mistakes include ignoring early unlock schedules or failing to track the ratio of staked versus circulating supply, both of which can mask impending dilution.
Another frequent error is overlooking cross-chain bridges that allow tokens to migrate to new ecosystems, suddenly increasing effective supply on the original chain. Regular review of bridge contract activity helps surface these hidden risks early.
FAQ on Long-Term Viability
How do onchain analytics predict token sustainability?
They reveal real usage patterns, liquidity stability, and distribution equity that fundamentals alone cannot show. By combining multiple metrics, analysts build a composite picture of whether a token economy can support ongoing development and user growth.
What metrics indicate healthy metaverse tokenomics?
Consistent velocity, diversified liquidity providers, and low concentration in top wallets signal strength. Additional indicators include stable or declining emission rates paired with rising active addresses.
Can inflationary pressures be reversed?
Yes, through protocol upgrades that introduce burns or staking rewards tied to actual activity. Successful reversals typically require community governance approval and clear onchain implementation that users can verify independently.
Which tools are most reliable for 2026 analysis?
Established platforms combining onchain data with visualization provide the clearest insights. Dune Analytics and block explorers remain foundational, supplemented by specialized metaverse dashboards that aggregate virtual-world-specific events.
How often should investors review onchain data?
Weekly reviews of distribution and velocity catch most meaningful shifts, while liquidity metrics warrant daily attention during high-volatility periods.
Conclusion
Onchain analytics equips participants with actionable intelligence for metaverse investments. By focusing on token flows, liquidity health, and distribution, stakeholders can favor projects built for enduring virtual economies. The discipline of continuous monitoring transforms tokenomics from opaque promises into measurable realities that guide better decisions across market conditions.

No comments yet. Be the first!