 CryptoChain Blog

Introduction to Modular Blockchain Tokenomics in 2026
Modular blockchain designs separate core functions like data availability, execution, and settlement into distinct layers. This separation directly impacts token economics by creating specialized tokens that interact across ecosystems. In 2026, onchain analytics reveal how these architectures influence supply dynamics, token velocity, and governance participation compared to monolithic chains that bundle everything into one protocol.
Investors and analysts increasingly rely on blockchain analytics tools to evaluate data availability layers, execution environments, and settlement tokens. This article examines real-world patterns through detailed case studies and provides actionable insights for interpreting onchain signals, helping readers make informed decisions about token utility and sustainability.
Understanding Modular Architectures and Their Token Implications
Modular blockchains divide responsibilities that monolithic chains handle in a single layer. Data availability layers ensure transaction data is accessible for verification, execution layers process smart contracts and state changes, and settlement layers finalize transactions with finality guarantees. Each layer often features its own native token, leading to unique tokenomics such as issuance schedules tied to specific utilities like staking rewards or fee payments.
Key metrics include supply issuance patterns, which show how new tokens enter circulation through emissions or unlocks, and cross-layer token flows that track value movement between modules for fees or bridging. Governance participation metrics measure voter turnout and proposal success rates, while liquidity concentration analysis highlights risks from uneven token distribution across exchanges or pools.
Supply Issuance Patterns in Modular Systems
Supply issuance in modular chains often follows tailored schedules to match layer-specific demands. For instance, data availability tokens may issue rewards based on blob storage usage, creating predictable inflation curves. Analysts examine onchain data for vesting cliffs, team allocations, and community incentives to forecast long-term dilution effects. In contrast, monolithic chains typically feature unified issuance tied to overall network security.
2026 examples demonstrate how modular issuance can lead to more granular control, allowing projects to adjust emissions dynamically based on usage metrics pulled from smart contracts.
Cross-Layer Token Flows and Velocity Analysis
Token flows across layers provide visibility into economic activity. Tokens move from settlement to execution for gas payments or from data availability to governance modules for voting power. Velocity measures how frequently tokens change hands, with modular designs often showing higher rates due to specialized use cases. Tools like graph-based explorers help map these flows, revealing bottlenecks or high-activity corridors.
Practical examples include tokens bridging between independent modules, which can increase overall ecosystem velocity while reducing concentration in any single layer.
Governance Participation Metrics
Governance in modular setups involves multiple tokens participating in decisions across layers. Metrics track delegation rates, proposal frequency, and execution success. High participation often correlates with transparent onchain voting mechanisms, while low turnout may indicate reliance on offchain signaling. Detailed analysis includes reviewing historical proposal outcomes to assess community alignment with token holder interests.
Liquidity Concentration Analysis
Liquidity concentration examines how tokens are distributed in decentralized exchanges and centralized venues. High concentration in few wallets or pools raises manipulation risks. Onchain queries reveal top holder percentages and pool depth over time, guiding risk assessment for large positions. Modular tokens frequently exhibit varied concentration due to their multi-layer utility, differing from monolithic tokens with more uniform distribution.
Case Study: Celestia Data Availability Layer
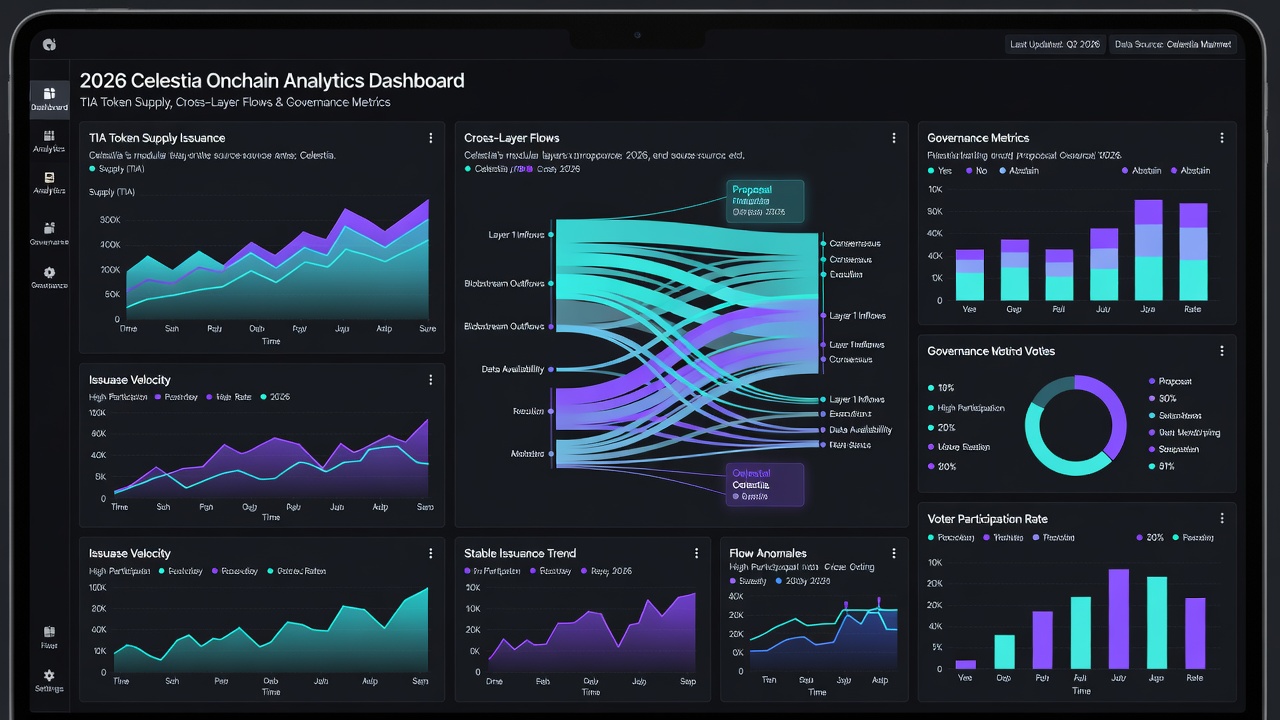
Celestia exemplifies a modular data availability layer with its TIA token. Onchain data from 2026 shows TIA issuance following a predictable schedule aligned with network growth. Step-by-step analysis using tools like Dune Analytics begins with querying total supply and circulating supply, followed by examining staking ratios, blob transaction fees paid in TIA, and historical unlock events.
Cross-layer flows demonstrate TIA moving into execution environments for fee payments and bridging to settlement layers. Governance metrics indicate active participation in upgrade proposals, with high quorum rates reflecting strong community engagement. Further examination covers validator performance data and fee market dynamics to understand token demand drivers.
Case Study: EigenLayer and Its Derivatives
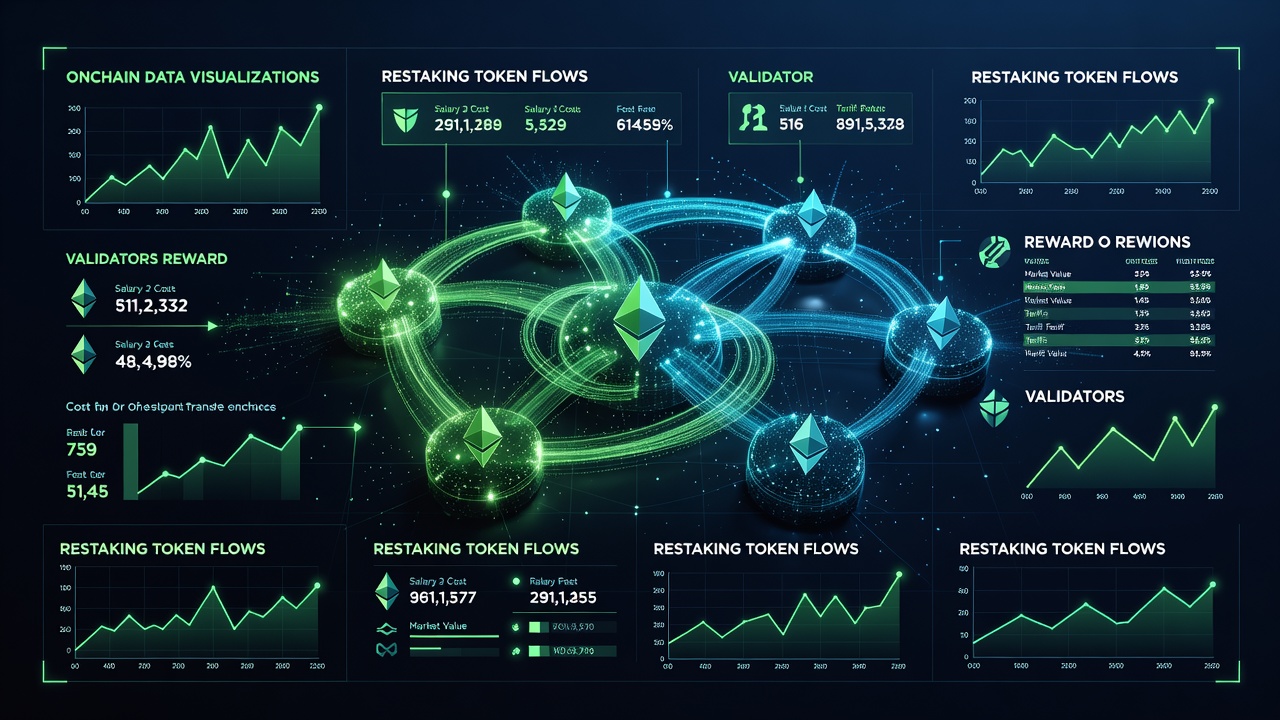
EigenLayer extends Ethereum through restaking, creating derivative tokens that inherit security from ETH while enabling new services. Onchain examination reveals how restaked ETH derivatives exhibit distinct velocity patterns, often lower than native modular tokens due to their composable nature and extended lockup periods. Analysts track restaking contracts for inflow volumes, analyze reward distribution across operators, and assess liquidity pools for concentration risks. These steps highlight how modular extensions create layered token economies with interconnected incentives.
Additional details include monitoring slashing events and operator performance to evaluate derivative token stability in 2026 environments.
Comparing Token Velocity: Modular vs Monolithic Chains
- Modular chains often display higher cross-layer velocity as tokens serve specialized roles across data, execution, and settlement functions.
- Monolithic chains like early Ethereum versions show consolidated velocity centered primarily on gas fees and single-layer staking.
- 2026 data indicates modular designs reduce single-token dominance, spreading economic activity and potentially lowering systemic risks.
- Key differences emerge in fee token usage and bridging activity, with modular setups enabling more frequent but smaller transfers.
Tables comparing velocity across chains help identify sustainable models versus speculative ones by highlighting consistent usage patterns over time.
Practical Steps for Onchain Analysis
- Connect analytics dashboards to relevant chains and verify data sources for accuracy.
- Query issuance and burn rates for supply trends, including scheduled unlocks and emissions.
- Map token flows using graph visualizations to identify major pathways and volume spikes.
- Evaluate governance smart contract interactions through proposal logs and voting records.
- Assess liquidity via decentralized exchange metrics such as pool sizes and slippage estimates.
- Cross-reference findings with multiple tools to validate signals and reduce false positives.
Common Pitfalls and How to Avoid Them
Interpreting onchain signals requires caution. Overreliance on short-term velocity can mislead during market volatility. Always consider broader context like protocol upgrades or macroeconomic factors. Another pitfall involves ignoring smart contract risks in cross-layer interactions, which can distort flow data. Regular audits of data sources and combining onchain metrics with qualitative research mitigate these issues.
FAQs on Interpreting Onchain Signals
How do I avoid misreading liquidity concentration? Focus on multiple timeframes and cross-reference with offchain order book data to distinguish organic from manipulated pools. Review historical trends for anomalies.
What pitfalls exist in governance metrics? Low turnout can signal apathy or efficient delegation; always review proposal content alongside participation rates and quorum requirements.
Are cross-layer flows reliable investment indicators? They provide directional insights but require context from overall market conditions and protocol upgrades for accurate interpretation.
How should supply issuance patterns influence decisions? Compare issuance rates against usage growth to determine if inflation supports or hinders token value accrual over time.
Conclusion
Modular blockchain tokenomics in 2026 offer nuanced opportunities revealed through rigorous onchain study. By examining projects like Celestia and EigenLayer in depth, analysts gain tools to navigate supply patterns, flows, governance, and liquidity effectively. Continued monitoring with authoritative resources such as Celestia, EigenLayer, and Ethereum supports informed decisions in this evolving space, fostering better evaluation of modular versus monolithic approaches.

No comments yet. Be the first!