 CryptoChain Blog
Introduction to NFT Marketplace Tokenomics in 2026
The NFT ecosystem in 2026 operates within a mature blockchain landscape where tokenomics define the long-term viability of marketplaces. Onchain analytics provide transparent, verifiable data that reveals how fees flow, rewards are distributed, and holder behaviors influence market stability. Developers and investors rely on these insights to assess whether a platform's economic model can withstand volatility and regulatory shifts. This comprehensive breakdown examines core metrics and practical applications, moving beyond surface-level overviews to deliver decision-useful analysis.
Tokenomics encompasses the design of incentives, token supply dynamics, and revenue mechanisms embedded in smart contracts. In an era of multi-chain expansion, understanding these elements through onchain queries separates sustainable projects from those prone to collapse. Historical patterns from 2024 and 2025 demonstrate that marketplaces with transparent reward structures retained users better during downturns.
Key Onchain Metrics for Tokenomics Analysis
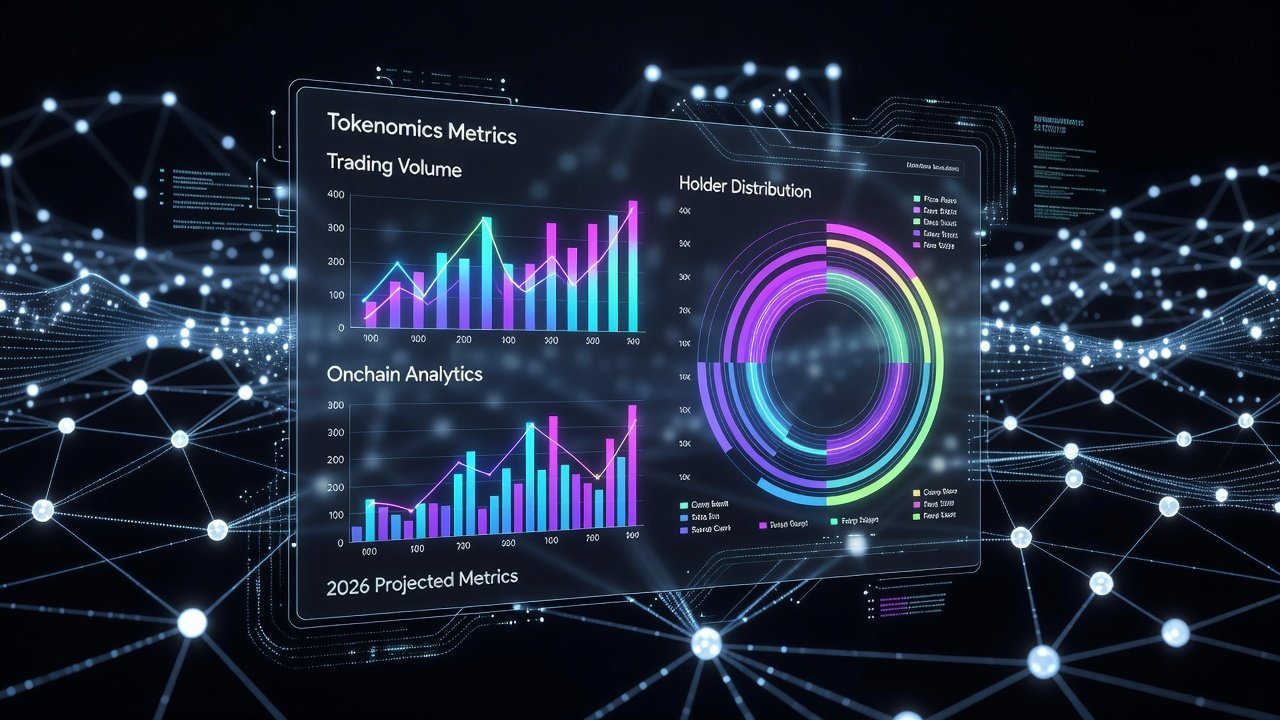
Trading volume flows serve as the foundational metric for evaluating marketplace health. Analysts examine not only aggregate volumes but also the distribution across buyer and seller cohorts, average transaction sizes, and cross-chain migration patterns. High volumes paired with low repeat trading may indicate speculative bubbles rather than organic growth.
Liquidity provider rewards, typically issued through governance tokens, encourage capital commitment but demand careful evaluation of emission schedules and dilution risks. Onchain data reveals the velocity of these rewards and whether they correlate with actual trading activity or merely inflate temporary metrics.
Holder concentration metrics highlight centralization risks. By querying token distribution across addresses, analysts identify whale dominance that could trigger sudden sell-offs. Tools enable visualization of concentration ratios over time, helping forecast governance capture or market manipulation potential.
Step-by-Step Fee Structure Analysis
Start by extracting protocol fee events from marketplace smart contracts to determine the percentage taken per transaction. Next, trace how collected fees are routed—whether to a treasury wallet, stakers, or burned entirely. Then factor in any dynamic adjustments based on volume thresholds or user tiers.
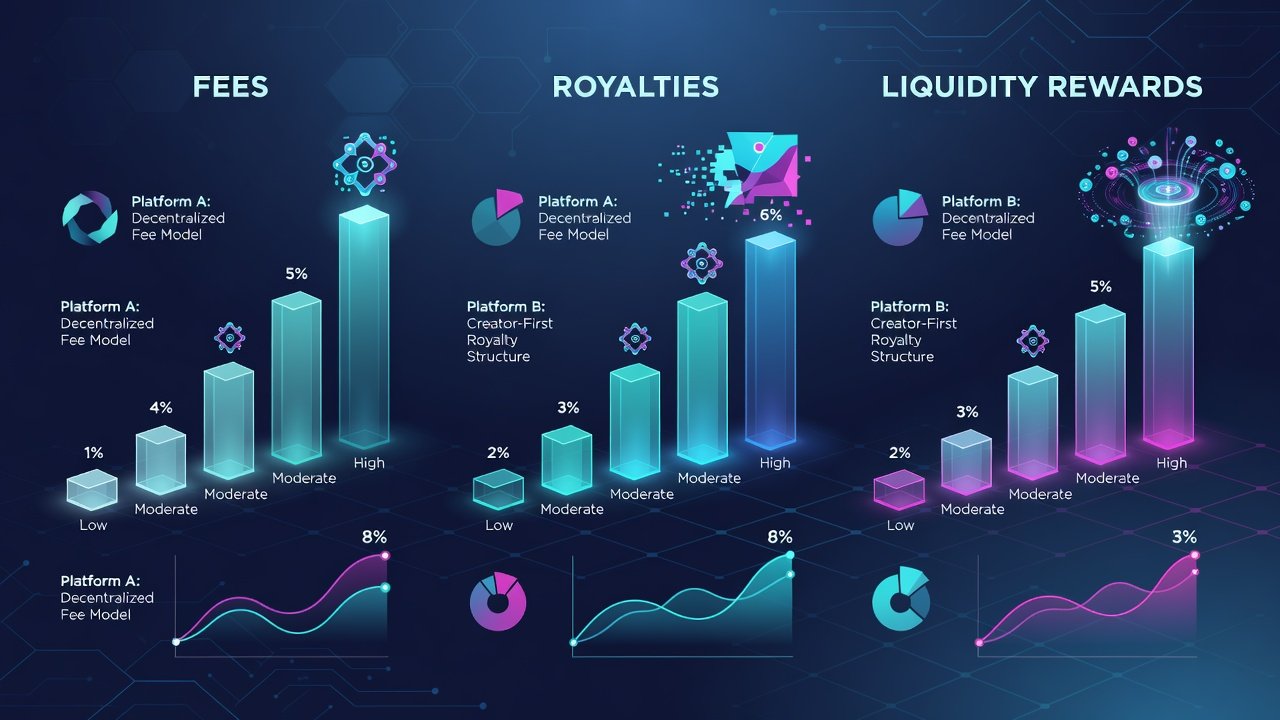
Real-world platform examples illustrate divergent approaches. Some marketplaces implement flat fees that simplify user experience while others use tiered models that reward high-volume traders with reduced rates. Comparing these onchain reveals which structures better balance revenue generation with user retention. Developers can replicate successful patterns by auditing open-source contracts and simulating fee impacts on hypothetical trading scenarios.
Royalty Enforcement Mechanisms Onchain
Royalty enforcement remains a critical differentiator for creator-friendly platforms. Modern implementations embed automatic royalty deductions directly into transfer functions, ensuring creators receive percentages on secondary sales without relying on offchain agreements. Auditing contract events allows verification of consistent payouts across thousands of transactions.
Enforcement strength varies significantly. Certain platforms hardcode royalties at the contract level, preventing bypasses, while others permit optional settings that reduce creator earnings. Historical onchain data shows platforms with strict enforcement maintain higher creator retention and long-term platform loyalty. Investors evaluating NFT projects should review royalty payout logs to gauge alignment between marketplace policies and creator incentives.
Platform Comparisons Using Blockchain Data
Leading NFT marketplaces display unique tokenomic signatures when analyzed onchain. One emphasizes aggressive liquidity mining programs that boost short-term volumes but risk token inflation. Another prioritizes stable holder bases through governance token staking requirements, fostering more predictable decision-making.
Comparisons should incorporate total value locked in liquidity pools, token transfer frequency as a proxy for velocity, and participation rates in onchain governance votes. These data points expose trade-offs between growth speed and economic resilience. Cross-referencing multiple chains further illuminates how platforms adapt models when migrating to lower-fee environments.
- Query smart contract logs for fee collection events over rolling 90-day periods.
- Calculate effective APY for liquidity providers after accounting for token price fluctuations.
- Map top ten holder addresses and their cumulative ownership percentages.
- Track royalty distribution events to confirm creator payout consistency.
Metrics Checklist for Investors and Developers
Apply this detailed checklist during due diligence on any NFT marketplace token:
- Retrieve and chart trading volume trends, segmenting by new versus returning users.
- Analyze liquidity provider reward emissions against actual protocol revenue.
- Assess holder concentration using Lorenz curves or Gini coefficients derived from onchain balances.
- Validate royalty enforcement by sampling random secondary sale events.
- Compare fee allocation splits with published treasury reports and community proposals.
- Monitor cross-chain bridge activity for signs of capital flight or expansion.
- Review governance proposal outcomes to understand token holder influence on future economics.
Common Pitfalls to Avoid
Many analysts overlook scheduled token unlocks that suddenly increase circulating supply and pressure prices. Relying exclusively on aggregated dashboards without verifying raw onchain data often produces misleading conclusions. Ignoring multi-chain flows underestimates how liquidity migrates to emerging ecosystems. Another frequent error involves assuming static fee models remain unchanged; always monitor contract upgrade events that alter economics without notice.
Forward-Looking Strategies for Sustainable Token Models
Developers building or upgrading marketplaces should prioritize adaptive fee mechanisms that scale with market conditions while preserving incentives for long-term participants. Integrating modular royalty standards allows flexibility across different NFT standards and chains. Investors benefit from continuous monitoring of emerging patterns in reward distribution and governance participation.
Resources such as Ethereum.org provide foundational documentation on smart contract patterns essential for implementing robust tokenomics. Dune.com supplies community-maintained dashboards that accelerate custom onchain queries. Additional reference material is available at Solana.com for cross-chain comparisons. By embedding these analytical practices into regular workflows, market participants can identify resilient models and avoid fragile ones in the dynamic 2026 environment.
Conclusion
Onchain analytics transform opaque tokenomics into clear, actionable intelligence for NFT marketplaces. Through systematic examination of volumes, rewards, fees, royalties, and concentrations, stakeholders gain the foresight needed to navigate evolving dynamics. Implementing the frameworks outlined here supports both immediate evaluation and long-term strategic planning in the NFT sector.
No comments yet. Be the first!