 CryptoChain Blog

Introduction to Decentralized Compute Tokenomics
In 2026, decentralized compute networks are reshaping how global infrastructure is funded and operated. Tokenomics—the economic design of native tokens—determines whether these networks can attract sustained participation without collapsing under inflationary pressure. Onchain analytics now provide unprecedented transparency into supply schedules, reward mechanisms, and staking dynamics, allowing investors and operators to evaluate viability before committing capital. This deep dive explores the interplay between blockchain data and economic sustainability, moving beyond surface-level overviews to deliver actionable insights for builders, validators, and token holders alike.
Decentralized compute projects rely on distributed nodes to deliver GPU, CPU, and storage resources for tasks ranging from AI training to scientific simulations. Their tokens must balance incentives for providers with protections against over-issuance. Onchain tools make it possible to monitor these balances in real time, revealing whether a network’s economics are truly sustainable or merely propped up by hype.
Supply Emission Schedules and Their Onchain Footprint
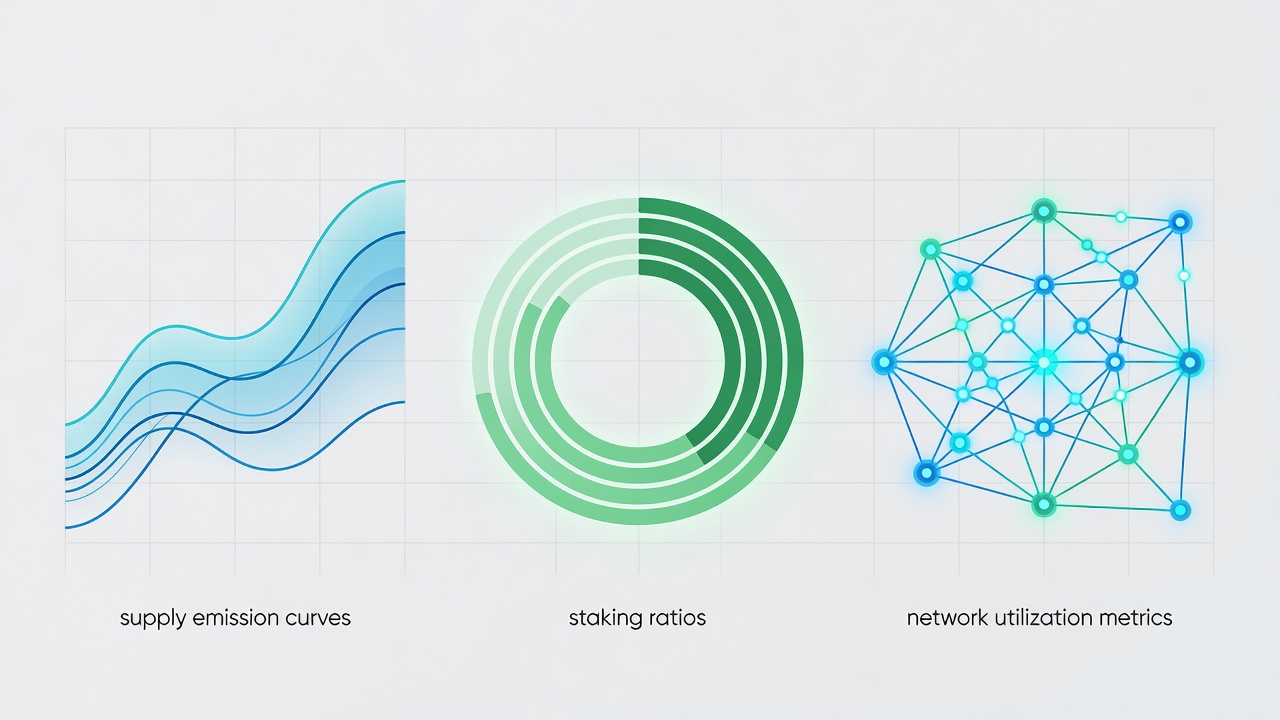
Emission schedules define how new tokens enter circulation. Most compute projects use halving events or linear decay curves tied to block production. Onchain explorers reveal real-time issuance rates and remaining supply caps. Sustainable models align emissions with network growth rather than fixed calendars, preventing early dilution that erodes validator returns. Analysts can query minting contracts to track cumulative supply against usage growth, spotting divergences that signal future pressure on token value.
Projects that publish emission dashboards allow direct comparison of projected versus actual supply growth. For instance, networks that adjust emission rates based on quarterly utilization data demonstrate greater resilience during market downturns. Onchain data also exposes any hidden minting privileges held by foundations or early investors, a critical factor for long-term trust.
Usage-Based Reward Mechanisms
Rewards in decentralized compute networks increasingly tie to verified work rather than simple uptime. Smart contracts measure compute jobs completed, data processed, or GPU hours delivered. This approach reduces token velocity by requiring active contribution before payouts occur. Real-world examples include protocols that weight rewards by job complexity, giving higher payouts for intensive machine-learning workloads compared to simple rendering tasks.
Key metrics include average reward per job and distribution across node operators. Onchain queries can filter rewards by address clusters to detect concentration risks. When rewards favor a small set of high-performance nodes, the network risks centralization despite its decentralized branding.
Staking Dynamics and Validator Incentives
Staking locks tokens to secure the network and earn yields. Compute projects often layer additional slashing conditions for poor performance or downtime. Onchain data shows staking ratios, average lock durations, and delegation patterns. Networks with longer average lock periods tend to exhibit lower selling pressure during volatility.
Comparisons between networks highlight differences in minimum stake requirements and reward compounding frequency. Higher staking participation generally correlates with lower token velocity and greater price stability. Validators must also consider opportunity costs, as locked tokens cannot be deployed elsewhere for liquidity provision or lending.
Network Utilization Metrics
Utilization serves as the ultimate health indicator. Analysts monitor active nodes, job throughput, and idle capacity via indexed blockchain events. Healthy networks maintain utilization above 60 percent while keeping reward rates competitive. Key metrics tracked onchain include:
- Daily active compute providers and their geographic spread
- Average job completion time across different hardware tiers
- Peak versus off-peak demand ratios that reveal capacity bottlenecks
- Revenue generated per node, helping operators decide where to allocate resources
These figures, when cross-referenced with emission data, paint a clear picture of whether token incentives are driving genuine demand or merely subsidizing idle hardware.
Fee Burn Impacts on Token Supply
Transaction and usage fees that are burned create deflationary pressure. Onchain tracking of burned volumes versus new emissions reveals net supply trends. Projects with meaningful burn rates can achieve equilibrium even during high-emission phases. Fee models vary: some charge per compute cycle while others use percentage-based revenue shares. Transparent burn ledgers allow precise modeling of long-term supply curves and help forecast when a token may transition from inflationary to deflationary.
Ethereum Foundation resources offer foundational examples of fee-burn mechanics that many compute networks adapt for their own architectures.
Validator Incentive Comparisons Across Networks
Different compute protocols offer varying yield profiles. Some emphasize base staking rewards while others add performance bonuses. Onchain leaderboards display real-time APY, slashing history, and operator concentration. Comparative analysis shows that networks balancing base rewards with usage bonuses achieve more stable validator sets. Over-reliance on inflationary emissions often leads to rapid churn when yields compress, forcing operators to seek higher returns elsewhere.
Practical Steps to Query Onchain Datasets
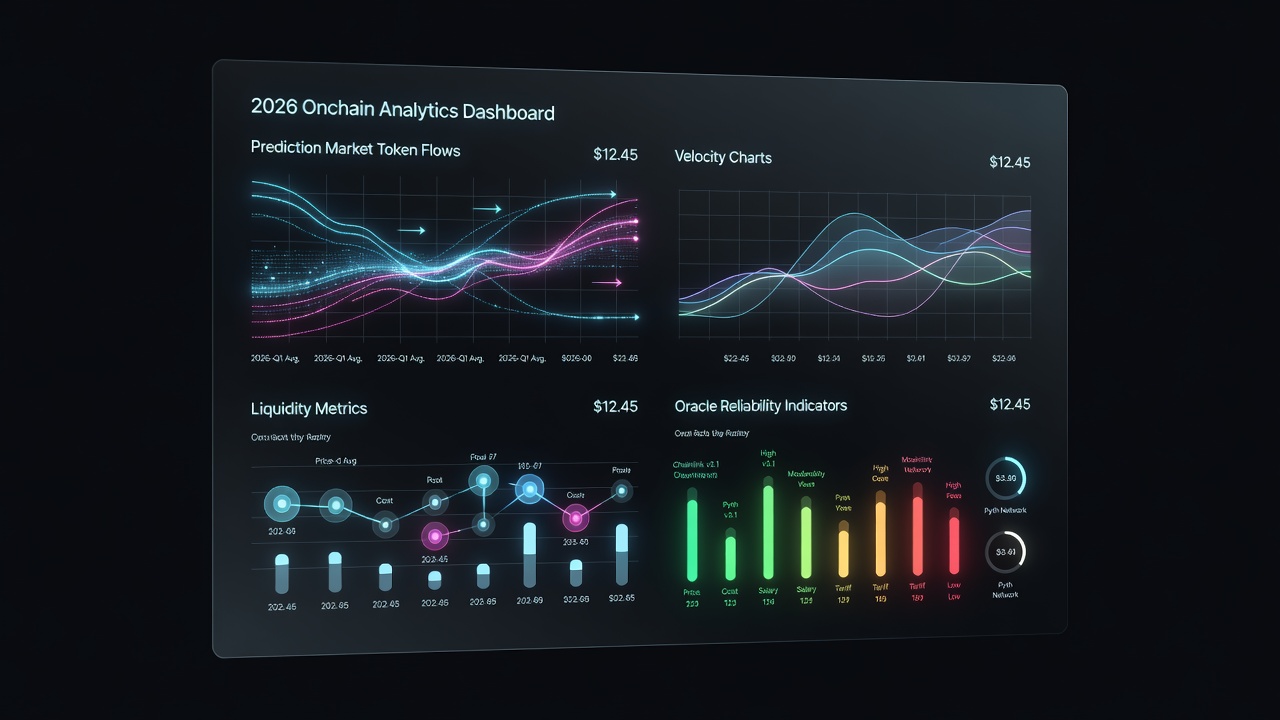
Readers can begin analysis using public indexing tools. Start by connecting to a node or using hosted APIs to pull token mint events. Next, filter for reward distribution contracts and aggregate daily totals. Velocity calculations require tracking transfer volumes against circulating supply over rolling windows. Interpretation focuses on whether velocity exceeds network growth; persistently high velocity signals weak holding incentives.
Advanced users can combine multiple data sources to build dashboards that correlate utilization spikes with token transfers. Regular monitoring helps identify early warning signs such as sudden drops in active nodes or unexplained minting events.
Interpreting Token Velocity in Compute Economies
Token velocity measures how frequently a token changes hands. In compute networks, high velocity often indicates that rewards are being sold immediately rather than reinvested. Sustainable models aim for velocity that grows in tandem with network usage, not faster. Onchain analytics platforms let users calculate 30-day and 90-day velocity trends, providing context for short-term fluctuations versus structural problems.
Bitcoin.org documentation on monetary velocity offers conceptual parallels that apply equally to compute tokens when adapted for usage-based economies.
Case Study: A Leading Compute Network in 2026
Consider a protocol that migrated from fixed emissions to usage-weighted rewards in early 2026. Onchain data showed staking ratios climbing from 42 percent to 67 percent within four months. Fee burns offset 85 percent of new issuance during the same period, stabilizing token supply. Utilization metrics reached 71 percent average, driven by AI training workloads. The transition reduced token velocity by 34 percent compared to the prior year. This example illustrates how transparent analytics can validate economic design changes in real time and guide similar upgrades in competing networks.
Operators in this case also published weekly onchain reports, allowing the community to audit reward distributions and confirm that no single entity dominated payouts.
FAQ: Common Pitfalls in Compute Token Models
What happens when emissions exceed usage growth?
Excess supply typically increases velocity and depresses token value, leading to validator exits and reduced network security. Early detection through onchain dashboards allows stakeholders to exit or pressure governance for corrective action.
How can staking concentration be detected?
Query the top 10 addresses holding staked tokens. If they control over 40 percent of the stake, centralization risk rises sharply and may trigger governance proposals to introduce delegation caps.
Why do some fee burn models fail to stabilize supply?
When burns are tied to low-volume transactions rather than core compute usage, the deflationary effect remains negligible. Projects must ensure burns scale directly with meaningful economic activity.
Is high utilization always positive?
Extremely high utilization can signal capacity constraints and rising costs for users, potentially driving demand to competing networks. Balanced utilization around 65-75 percent often represents the sweet spot for growth without service degradation.
Conclusion
Onchain analytics equip participants with the tools to evaluate decentralized compute tokenomics rigorously. By focusing on emission schedules, usage rewards, staking dynamics, and burn mechanisms, stakeholders can identify networks positioned for sustainable growth in 2026 and beyond. Regular data review and community governance participation remain essential for long-term success.

No comments yet. Be the first!