 CryptoChain Blog
Introduction to Protocol Token Liquidity Stress Testing in 2026
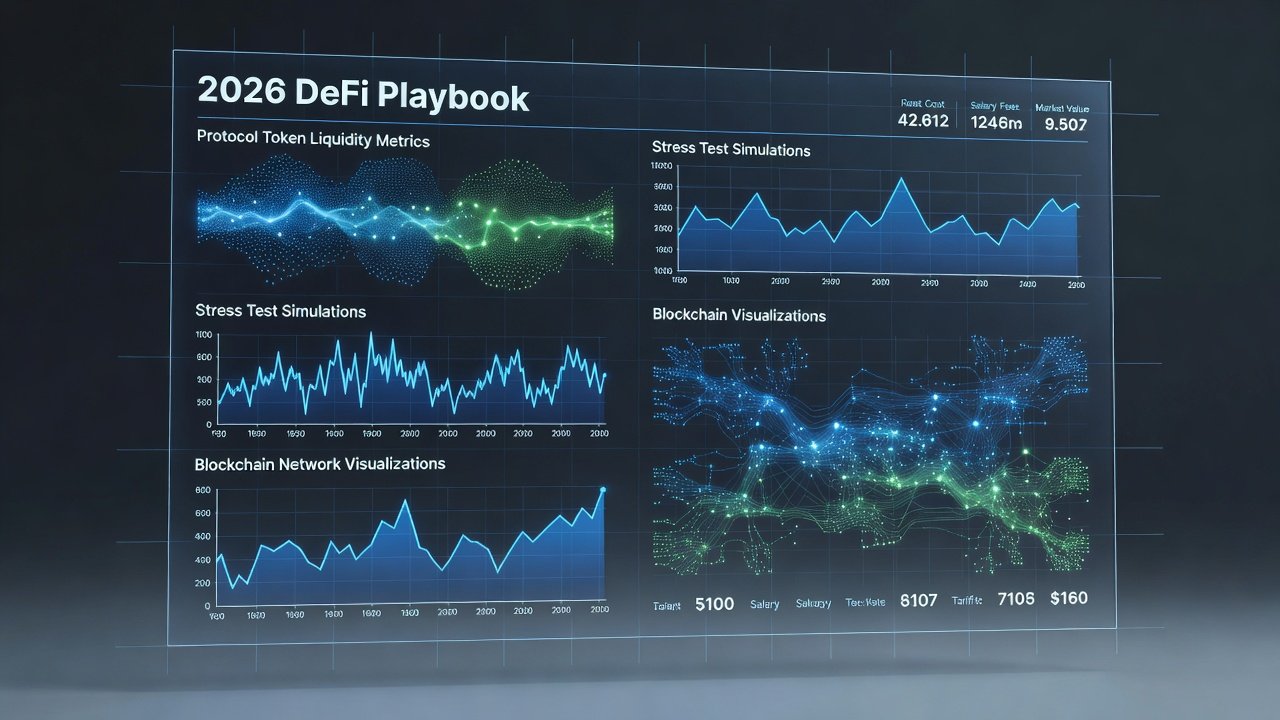
Stablecoin liquidity stress tests have long served as a benchmark for DeFi resilience. In 2026, leading protocols are extending these workflows to general protocol tokens to better manage volatility and redemption pressures. This playbook details actionable onchain methods for real-time pool depth monitoring, redemption queue modeling, DEX slippage tracking, and custom alert setups. Teams managing tokens in lending markets, decentralized exchanges, and yield protocols now apply these expanded frameworks to anticipate liquidity crunches before they impact users.
By focusing on metrics from protocols like Aave and Uniswap, teams can identify risks early and maintain protocol health. These tests help quantify how token velocity and holder concentration affect liquidity under stress. The shift from stablecoin-only testing reflects the growing complexity of token economies where governance votes, staking rewards, and external market shocks interact simultaneously.
Why Expand Stress Tests Beyond Stablecoins
Stablecoins benefit from predictable peg mechanisms, but protocol tokens face additional variables such as governance changes and yield farming dynamics. Expanding workflows allows risk managers to simulate scenarios where token demand drops sharply while redemptions rise. This approach builds on proven stablecoin methods while addressing unique tokenomics challenges that can amplify losses during market downturns.
Protocol tokens often serve dual roles as both utility assets and collateral, creating feedback loops absent in stablecoin systems. Stress testing these tokens reveals hidden fragilities in liquidity provision and redemption flows that standard models overlook. Protocols that fail to adapt risk sudden liquidity evaporation when large holders exit simultaneously.
Real-Time Pool Depth Monitoring
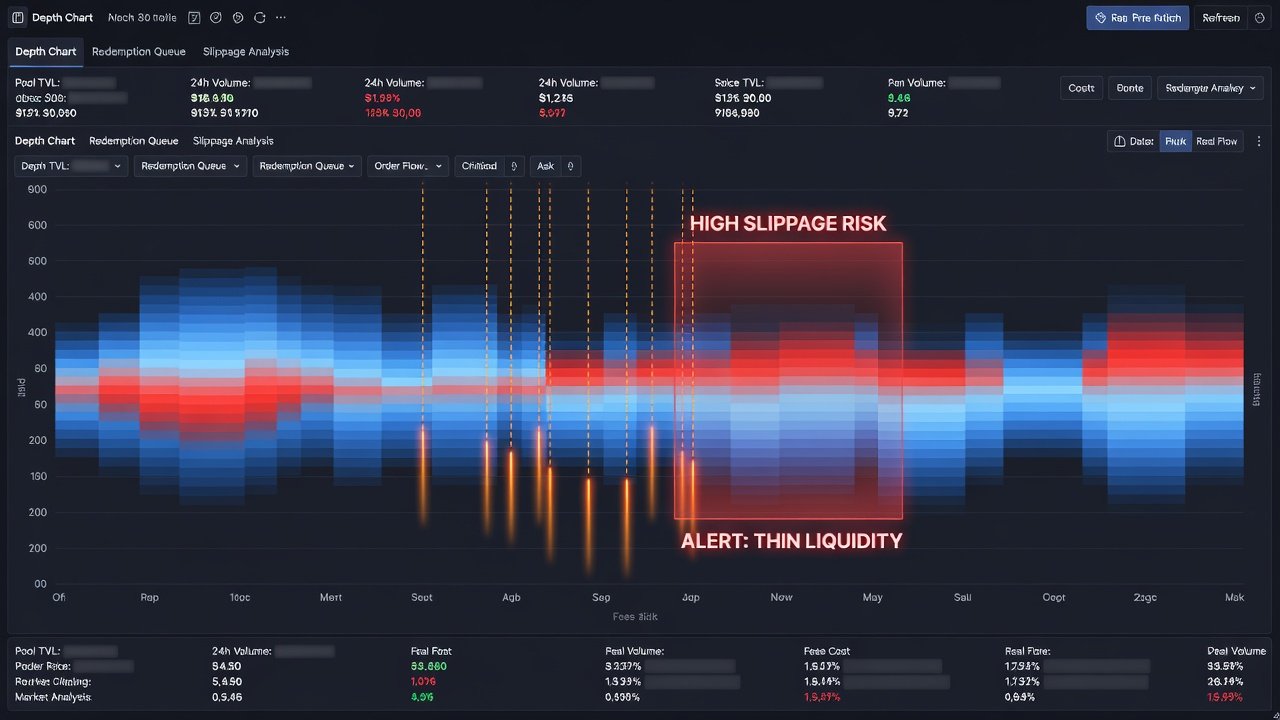
Effective monitoring starts with tracking liquidity across major DEX pools. Use onchain queries to measure available depth at various price levels. For example, query reserves in Uniswap V3 pools every few minutes to detect thinning liquidity layers. Tools like DeFiLlama provide baseline data that can be combined with custom scripts for deeper analysis.
Key metrics include total value locked in the pool and the size of orders that would move the price by 5% or more. Set thresholds that trigger reviews when depth falls below historical averages. Advanced setups integrate multiple DEX sources to create a composite depth score that accounts for cross-pool arbitrage opportunities. Regular monitoring also tracks how liquidity providers respond to incentive changes, allowing teams to forecast depth erosion during reward adjustments.
Redemption Queue Modeling
Redemption queues reveal potential bottlenecks during high-stress periods. Model these by simulating concurrent withdrawal requests against available liquidity. Protocols can use historical data from past events to calibrate models and predict queue lengths under 10x normal volume. This modeling incorporates variables such as time-of-day patterns and correlation with broader market volatility.
Practical Steps for Modeling
- Collect onchain redemption event logs from the past 90 days.
- Apply Monte Carlo simulations to generate stress scenarios.
- Calculate average and peak queue clearance times.
- Compare results against protocol treasury buffers.
- Validate outputs against live testnet environments before mainnet deployment.
DEX Slippage Tracking and Velocity Impact Analysis
Slippage tracking measures price impact during large trades. Integrate APIs from multiple DEX aggregators to monitor real-time slippage for protocol token swaps. Velocity impact analysis then correlates trading speed with liquidity drain, highlighting how rapid sells amplify slippage. Teams examine the relationship between transaction frequency and cumulative price deviation to set early-warning thresholds.
Practical examples include reviewing historical events where velocity spikes preceded major drawdowns. By layering velocity data onto slippage curves, risk teams can distinguish between organic trading and coordinated exit pressure. This dual analysis supports more accurate capital reserve planning.
Holder Concentration Red Flags
High concentration among top holders increases vulnerability to coordinated exits. Monitor wallet distribution using onchain analytics. Red flags appear when the top 10 wallets control more than 40% of circulating supply. Regular audits help flag these patterns before they escalate into liquidity crises.
Additional signals include sudden wallet clustering or transfers to known exchange addresses. Protocols should maintain dashboards that visualize concentration trends over rolling 30-day windows. When concentration metrics breach internal limits, governance proposals for staggered vesting or buyback mechanisms can be activated promptly.
Custom Onchain Alert Setups
Build alerts using platforms that support webhook integrations. Configure notifications for pool depth drops, unusual redemption spikes, and slippage thresholds. Combine these with velocity metrics to create multi-factor alerts that reduce false positives. Effective setups route alerts to both internal dashboards and community channels for transparent risk communication.
Comparison Table: Stress Test Approaches
| Metric | Stablecoin Focus | Protocol Token Focus |
|---|---|---|
| Pool Depth | Peg stability checks | Multi-level price impact |
| Redemption | 1:1 asset backing | Queue and velocity modeling |
| Alerts | Simple peg deviation | Multi-factor onchain triggers |
| Holder Analysis | Minimal | Concentration and velocity correlation |
Case Studies from Leading DeFi Protocols
Examining implementations at established protocols provides concrete templates. Aave’s liquidity risk framework incorporates daily pool depth scans across multiple chains and models redemption queues using historical borrow data. Uniswap governance discussions have highlighted the value of velocity tracking during incentive program launches. These examples demonstrate how combining onchain queries with simulation engines creates repeatable, auditable stress test processes.
Practical Dashboards and Key Metrics
Actionable dashboards surface the most relevant metrics at a glance. Core indicators include average slippage per 100k token trade, median redemption clearance time, and top-holder concentration ratio. Teams often layer these into unified views that update every block or minute depending on protocol activity levels. Integrating these dashboards with governance portals enables rapid decision-making when thresholds are crossed.
Mistakes to Avoid When Implementing Tests
- Over-relying on single-chain data without cross-referencing secondary markets.
- Ignoring governance-driven token emissions that can suddenly alter velocity.
- Setting static thresholds instead of dynamic ones calibrated to market conditions.
- Failing to backtest models against both bull and bear market regimes.
FAQ on Implementing Liquidity Stress Tests
How often should tests run?
Run daily baseline tests with weekly deep simulations for comprehensive coverage.
Which protocols provide the best examples?
Study implementations from Aave and similar lending markets documented on Ethereum.org.
What tools are essential?
Combine Dune Analytics for queries with custom dashboards for visualization.
How should results influence governance?
Share summarized findings in forum posts and propose parameter adjustments when stress metrics exceed predefined safety bands.
Conclusion
Implementing these expanded stress tests equips DeFi teams with robust risk management for 2026. By integrating monitoring, modeling, and alerts, protocols can navigate volatility with greater confidence and protect user funds effectively. Continuous refinement of these workflows will remain essential as token economies grow more interconnected.

No comments yet. Be the first!