 CryptoChain Blog

Introduction to Stablecoin Redemption Flows
Stablecoin redemption flows represent one of the most critical onchain signals for liquidity health and market stress in 2026. As DeFi matures, analysts need precise workflows to monitor how redemptions move across exchanges, wallets, reserves, and bridges. This playbook builds on basic reserve and peg monitoring by delivering actionable, data-driven techniques tailored for advanced practitioners seeking deeper operational insights into market dynamics.
Redemption activity often precedes or coincides with volatility spikes, making early detection essential for risk management. Tracking these flows helps identify potential liquidity crunches before they impact broader markets or trigger cascading liquidations in lending protocols. The focus here is on 2026-era tools and datasets that provide granular visibility into USDT and USDC movements, enabling analysts to differentiate between routine trading and stress-induced redemptions. By combining multiple data sources, professionals can build robust monitoring systems that deliver timely signals during both calm and turbulent periods.
Core Metrics for Redemption Tracking
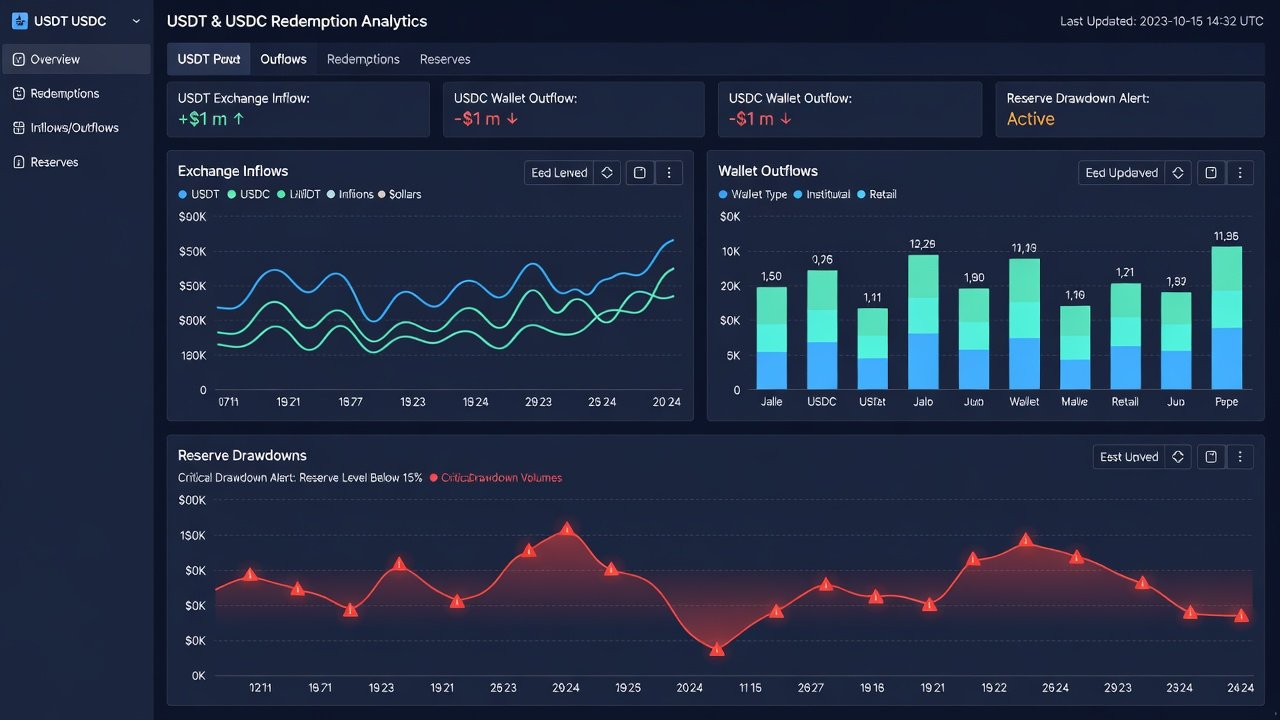
Effective tracking starts with four primary metrics that together form a comprehensive view of redemption pressure. Exchange inflows measure stablecoins moving into custodial addresses, often signaling intent to redeem for fiat. These inflows are best tracked using labeled datasets that identify major exchange hot wallets across Ethereum, Tron, and Solana networks. Wallet cohort outflows track large holders or smart contracts releasing tokens to exchanges, providing clues about institutional or whale behavior. Reserve drawdowns reflect issuer-side balance changes reported onchain or via attestations, highlighting when issuers are actively burning tokens to meet redemption demands.
Cross-chain bridge activity captures stablecoins migrating between networks, which can mask or amplify redemption pressure depending on whether inflows or outflows dominate. These metrics should be monitored in combination rather than isolation. A spike in exchange inflows paired with reserve drawdowns typically indicates coordinated redemptions rather than routine trading activity. In 2026, analysts increasingly layer velocity metrics and cohort segmentation to refine these signals further, reducing noise from automated market maker activity or simple transfers between personal wallets.
Step-by-Step Alert Setup for 2026 Workflows
Begin by connecting to onchain data platforms such as Dune Analytics or Nansen. Create custom dashboards that aggregate exchange deposit addresses for major custodians including Binance, Coinbase, and Kraken. Set threshold alerts for inflows exceeding historical averages by 200% within a 4-hour window, with secondary alerts for sustained activity over 12 hours. Configure notifications via webhook integrations to Slack or Discord channels used by your team for rapid response.
Next, define wallet cohorts using labeling services that categorize addresses by size and behavior patterns. Monitor outflows from addresses holding over $1 million in stablecoins, with filters excluding known market makers. Integrate bridge contract monitoring for protocols like Wormhole and Across to catch cross-chain redemptions early, focusing on burn events that reduce circulating supply on origin chains. Finally, layer reserve data feeds from issuers into your alert system for real-time drawdown notifications, ensuring you receive updates within minutes of attestation publications. Test your full alert stack during low-volatility periods to calibrate thresholds and minimize false positives.
Interpreting Signals During Stress Events
During market stress, redemption flows accelerate rapidly and often exhibit distinct patterns that require careful interpretation. In March 2026 volatility episodes, analysts observed USDC exchange inflows rising sharply while bridge outflows to Layer-2 networks slowed dramatically. This pattern frequently signals de-risking by institutions rather than routine arbitrage opportunities. Sustained exchange inflows above 3x baseline for more than 12 hours warrant heightened scrutiny and potential portfolio adjustments.
Simultaneous reserve drawdowns and bridge activity may instead indicate capital rotation across ecosystems rather than outright redemption. Always cross-reference with offchain news and social sentiment for full context, as isolated onchain spikes can result from technical migrations or large OTC settlements. Analysts should also track net flows rather than gross volumes to avoid overreacting to high-frequency trading noise that does not reflect genuine redemption intent.
USDT Versus USDC Redemption Behavior
USDT and USDC exhibit distinct redemption signatures that demand separate monitoring strategies. USDT redemptions frequently route through offshore exchanges and show higher tolerance for temporary depegs, often resulting in slower reserve transparency updates. USDC flows tend to concentrate on regulated platforms with faster reserve transparency updates and more predictable institutional behavior patterns.
Comparative analysis in 2026 reveals USDC outflows from institutional wallets often precede regulatory announcements or macroeconomic data releases, while USDT activity clusters around retail-heavy exchanges during retail-driven panic events. Analysts should maintain separate alert profiles for each stablecoin to avoid false positives and tailor response protocols accordingly. Understanding these behavioral differences allows for more accurate forecasting of liquidity impacts across different market segments.
Real Project Examples and Custom Query Templates
Consider the case of a major DeFi lending protocol that experienced a redemption cascade in Q2 2026. Onchain data showed concentrated outflows from three wallet cohorts to Binance and Coinbase within 48 hours, followed by a 15% reserve drawdown reported by the issuer. This sequence allowed proactive analysts to reduce exposure before broader market contagion occurred.
Sample query template for Dune: SELECT block_time, amount, from_address FROM stablecoin_transfers WHERE to_address IN (exchange_labels) AND token = 'USDT' AND amount > 500000 ORDER BY block_time DESC. A second template for wallet cohort analysis might filter by address labels and time windows to isolate large outflows. A third template focused on bridge activity can aggregate burn events across multiple chains. Adapt similar logic for wallet cohorts and bridge contracts using labeled datasets available on public analytics platforms.
Mistakes to Avoid When Tracking Redemption Flows
- Ignoring multi-chain activity by focusing only on Ethereum, which misses significant Tron and Solana flows common in USDT redemptions.
- Setting alerts too sensitive to short-term spikes without baseline normalization, leading to alert fatigue during normal market conditions.
- Failing to distinguish between custodial inflows and internal exchange movements, which inflates perceived redemption pressure.
- Overlooking reserve attestation timing, as delayed reports can create blind spots during fast-moving stress events.
FAQ: Common Analyst Pitfalls
- How do I distinguish redemptions from trading activity? Focus on net flows to known custodian addresses rather than total volume across all addresses.
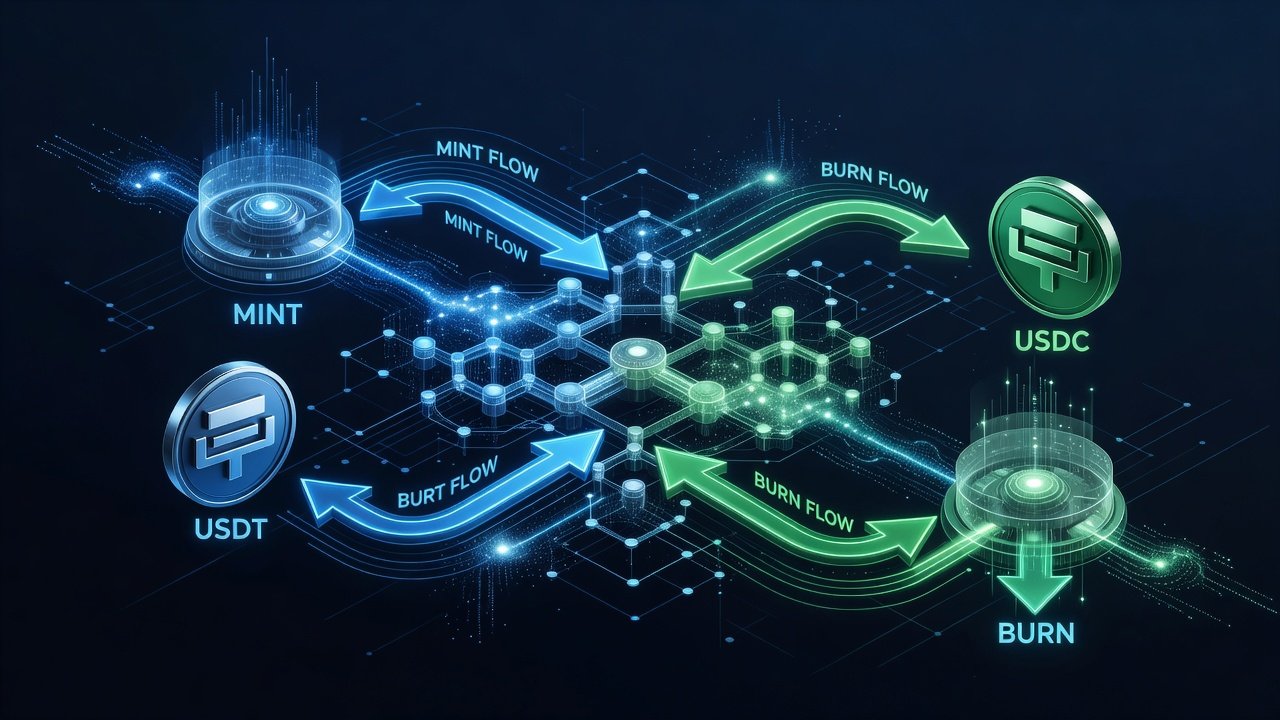
- Why do cross-chain bridges complicate tracking? Stablecoins can be minted or burned on secondary chains, requiring multi-network monitoring and burn event detection.
- What data lag should I expect? Most 2026 dashboards update within 2-5 minutes, but reserve attestations may lag by several hours depending on the issuer.
- Are there free alternatives to paid analytics platforms? Open datasets on Dune Analytics and DefiLlama provide solid starting points for building custom dashboards without subscription costs.
- Should I monitor social sentiment alongside onchain data? Yes, combining onchain flows with sentiment analysis improves signal accuracy during ambiguous events.
Conclusion
Mastering stablecoin redemption flows requires combining multiple onchain lenses with disciplined alert systems and ongoing refinement. By focusing on the metrics and workflows outlined above, DeFi analysts gain an operational edge in anticipating liquidity shifts across USDT and USDC ecosystems. This advanced playbook serves as a practical companion to foundational reserve monitoring resources, enabling deeper insights into 2026 market dynamics. Continue refining queries against live data to stay ahead of evolving redemption patterns and maintain robust risk oversight.
No comments yet. Be the first!