 CryptoChain Blog

Stablecoin Demand Signals: 2026 Onchain Tokenomics Guide
In 2026, stablecoin tokenomics hinge on precise demand forecasting derived from onchain data. Analysts now rely on transparent blockchain signals rather than offchain speculation to predict growth, sustainability, and market shifts. This guide explores core metrics, practical tracking methods, scenario comparisons, and actionable strategies for identifying reliable demand indicators across major stablecoins such as USDT, USDC, and DAI. Understanding these signals helps investors, issuers, and DeFi participants anticipate liquidity needs and avoid overexposure during volatile periods.
Core Onchain Metrics for Demand Forecasting
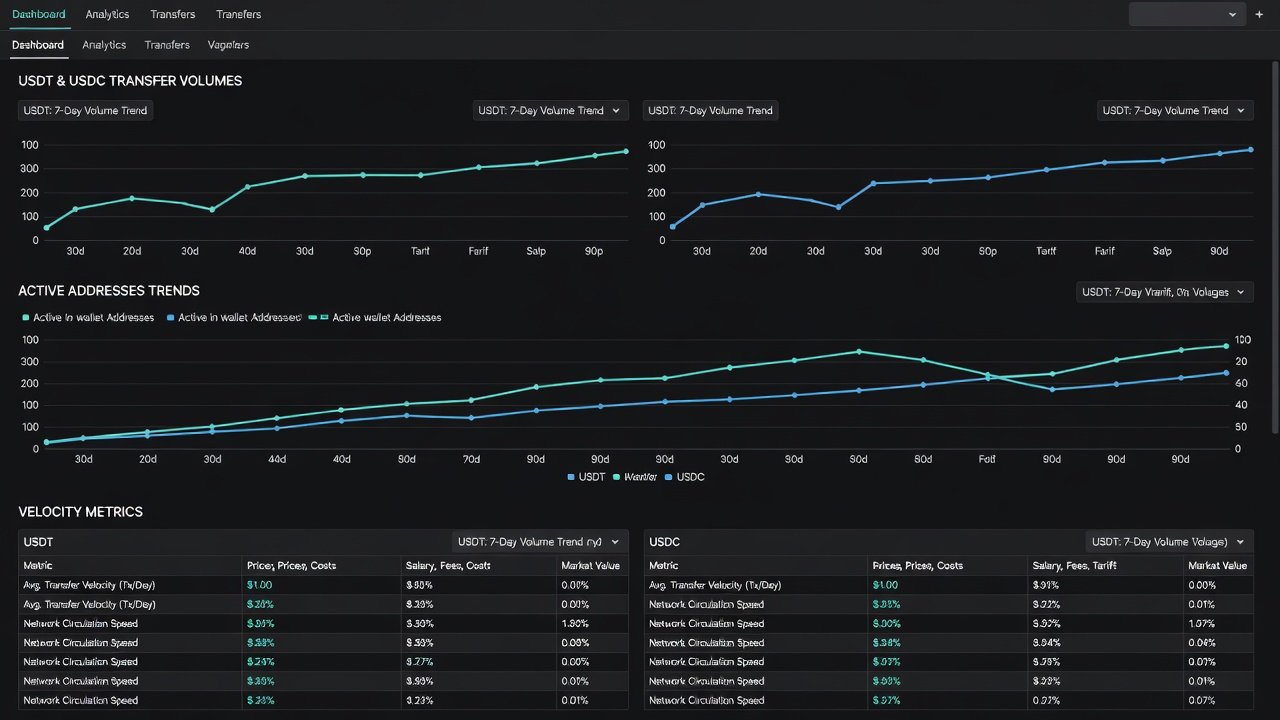
Transfer volumes reveal circulation velocity and usage intensity. Rising volumes without corresponding price volatility often signal organic adoption by merchants, traders, and protocols. Active addresses provide a view of unique participants, helping distinguish between speculative spikes and sustained utility from everyday payments or collateralization. DeFi integration patterns show how stablecoins embed into lending, trading, and yield protocols, indicating structural demand that persists beyond short-term hype.
Additional signals include holder distribution across wallets and exchange inflows. Concentrated holdings in smart contracts versus retail wallets can foreshadow different demand trajectories. Exchange reserve levels on centralized platforms also matter because sudden outflows often precede increased onchain activity. These metrics together form a holistic picture of token health in evolving market conditions. Cross-chain comparisons further refine forecasts, as stablecoins migrate between Ethereum, Tron, and Solana based on fee environments and ecosystem incentives.
Step-by-Step Examples of Tracking Demand
Begin by connecting to public dashboards such as those on Dune or DeFi Llama. Filter for specific stablecoins like USDT or USDC and set time ranges to 30-day rolling windows. Track daily transfer counts alongside unique active addresses to spot correlations with total value locked in DeFi pools. Export raw data into spreadsheets for custom velocity calculations.
Next, layer in velocity calculations by dividing transfer volume by circulating supply. Cross-reference this with reserve transparency reports from issuers. For a real setup, create alerts when active addresses exceed a 20% month-over-month increase while DeFi TVL share grows steadily. Advanced users can script queries that combine multiple chains, weighting results by economic throughput rather than raw counts.
Example workflow one: Query Ethereum mainnet data for USDC transfers above a threshold, then map results to Aave and Uniswap activity. Repeat across Tron and Solana chains for multi-network visibility. This approach uncovers cross-chain demand migration patterns. Example workflow two: Monitor DAI holder cohorts by wallet creation date to identify whether new addresses represent genuine users or bots. Combine findings with governance proposal activity on MakerDAO forums to gauge community-driven demand shifts. These repeatable processes allow analysts to build reliable early-warning systems.
Bull Versus Bear Market Holder Behaviors
In bull scenarios, holders demonstrate higher velocity as stablecoins flow rapidly into yield opportunities and leveraged positions. Active addresses surge, often led by new wallet creation from retail participants entering through centralized exchanges. DeFi integrations deepen with increased collateralization rates and higher borrowing demand. Holder distribution spreads toward smaller wallets, reflecting broader participation.
Bear markets show the opposite: reduced transfer volumes, longer holding periods in cold wallets, and contraction in DeFi usage as liquidity providers withdraw. Holder concentration may increase among large entities, raising sustainability questions if reserve backing remains static. Exchange inflows spike during panic phases, temporarily masking underlying demand weakness. Comparative analysis reveals that tokens maintaining steady active address growth even in downturns tend to recover faster, highlighting resilience tied to real utility rather than hype cycles. Historical patterns from 2022-2025 show that stablecoins with diversified chain footprints recovered 30-40% quicker than single-chain counterparts.
Actionable Tips for Analysts
- Combine velocity metrics with real-time reserve attestations to validate whether volume growth reflects genuine demand or temporary arbitrage opportunities.
- Monitor chain-specific nuances, such as lower fees on alternative L1s driving higher transfer counts without proportional economic activity; normalize data accordingly.
- Use cohort analysis to segment holders by wallet age and balance size, identifying sticky demand from long-term users versus transient traders seeking quick yields.
- Integrate onchain data with macroeconomic indicators like interest rate shifts to contextualize demand elasticity and prepare for policy-driven liquidity changes.
- Build automated dashboards that flag anomalies, such as sudden drops in active addresses coinciding with reserve report delays, for proactive risk management.
These practices help avoid misinterpreting short-term noise as structural trends and improve forecast accuracy over time.
Implications for Token Sustainability
Sustained demand supports issuer profitability through reserve yields and transaction fees. However, over-reliance on a single metric can mask risks such as regulatory changes or competing stablecoin launches. Tokens demonstrating diversified chain presence and consistent DeFi embedding show stronger long-term viability. Analysts should prioritize signals that correlate with actual economic throughput over raw volume spikes. This focus promotes healthier tokenomics ecosystems overall and encourages issuers to maintain transparent reserves and multi-chain strategies. In 2026, sustainability increasingly depends on resilience during both expansion and contraction phases rather than peak bull-market metrics alone.
FAQ on Common Pitfalls in Interpretation
How do I distinguish organic demand from wash trading?
Examine address clustering and transfer patterns. Repeated circular flows between a small set of addresses often indicate manipulation rather than genuine usage; tools like address labeling services can help filter these out.
Should I weight all chains equally when aggregating metrics?
No. Adjust for fee structures and user bases. High-volume low-value transfers on low-fee chains require normalization against economic impact to avoid inflating perceived demand.
What role does reserve data play alongside onchain signals?
Reserve attestations confirm backing quality. Pairing them with velocity prevents overestimating demand from leveraged or synthetic positions that may unwind quickly.
Can social sentiment replace onchain metrics for forecasting?
No. Social volume often leads or lags actual usage by weeks. Onchain data provides verifiable ground truth that sentiment analysis alone cannot match.
How frequently should dashboards be updated for reliable signals?
Daily updates suffice for most trends, but critical alerts during high-volatility periods benefit from hourly refreshes to capture rapid shifts in active addresses and transfer flows.
By mastering these onchain techniques, analysts gain a forward-looking edge in the 2026 stablecoin landscape. DeFi Llama and Dune provide the foundational data layers for ongoing monitoring and custom query development.

No comments yet. Be the first!