 CryptoChain Blog
Stablecoin Holder Behavior Analysis: 2026 Onchain Tokenomics Insights
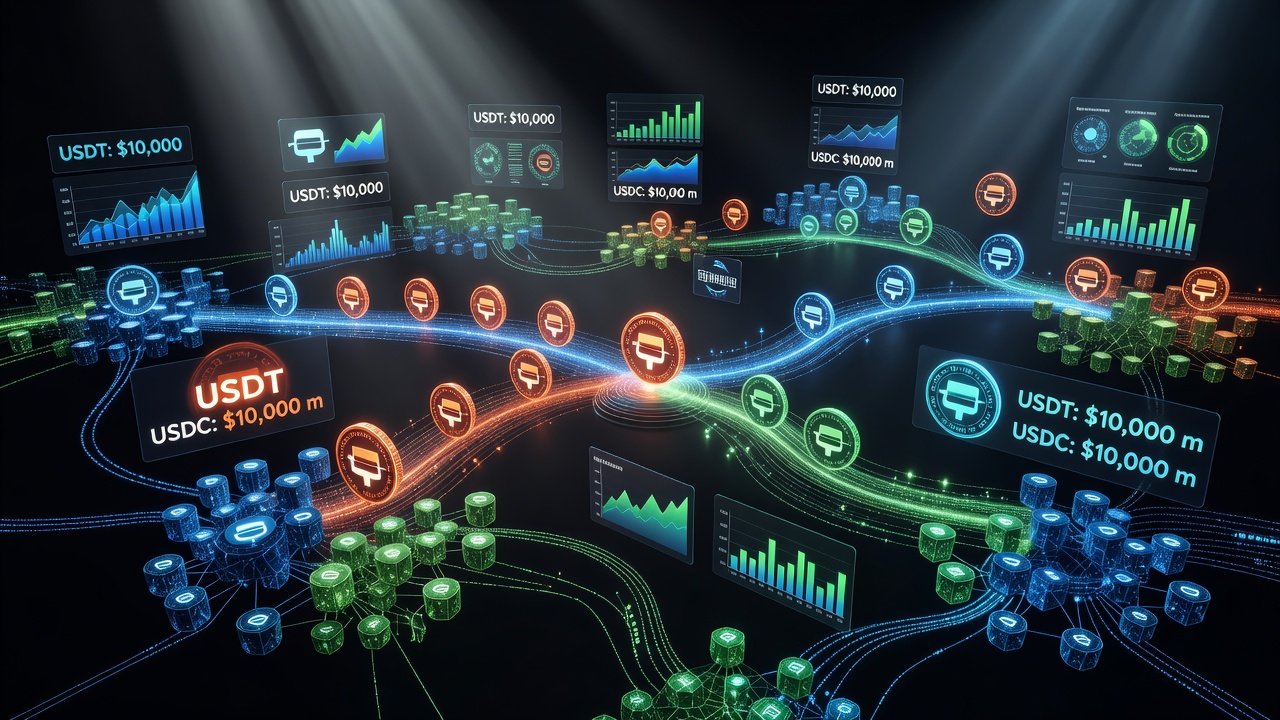
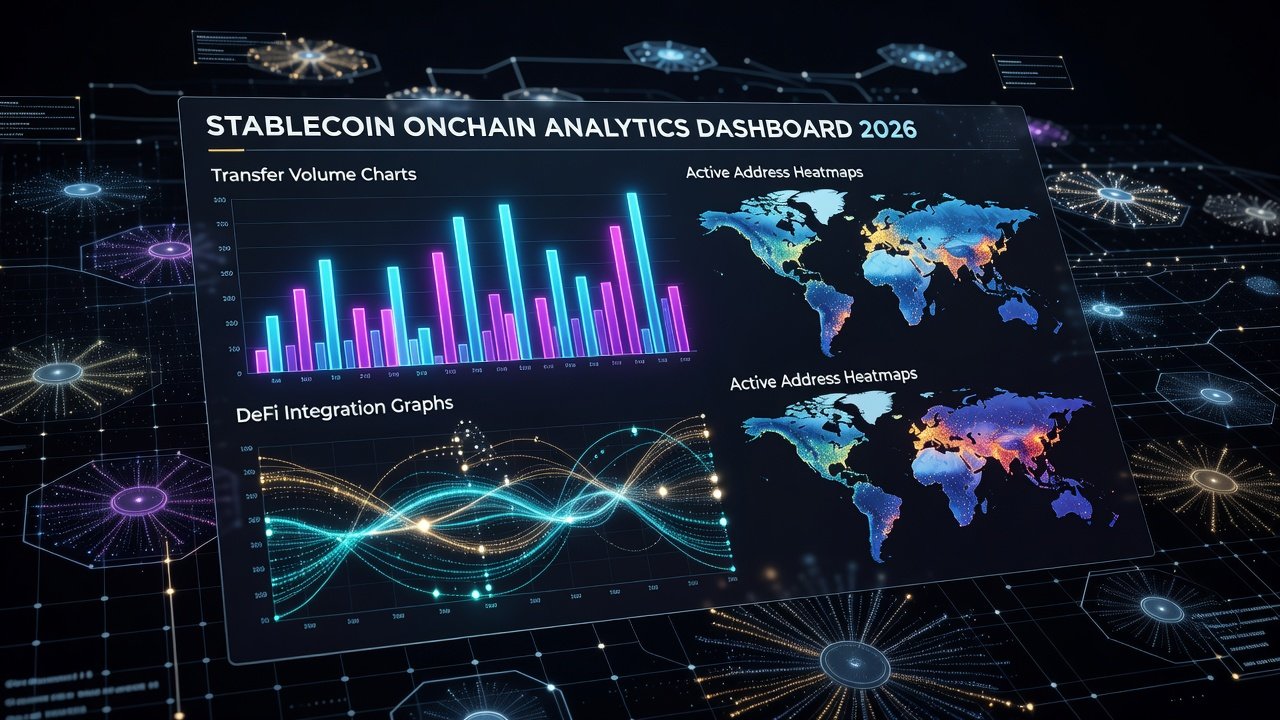
In 2026, stablecoin ecosystems continue to evolve rapidly, with onchain analytics providing unprecedented visibility into holder behaviors. This analysis examines key metrics such as wallet clustering, average holding periods, transfer velocity, and concentration shifts across major assets like USDT and USDC. Understanding these patterns helps DeFi participants, liquidity providers, and tokenomics researchers anticipate market movements and optimize strategies. Stablecoins have become essential infrastructure for trading, payments, and collateral in decentralized finance, handling massive transaction volumes daily across multiple blockchains including Ethereum, Tron, and Solana. Onchain data goes far beyond basic supply metrics to uncover nuanced holder dynamics that can signal upcoming liquidity shifts or demand changes.
Understanding Core Holder Metrics in Stablecoin Tokenomics
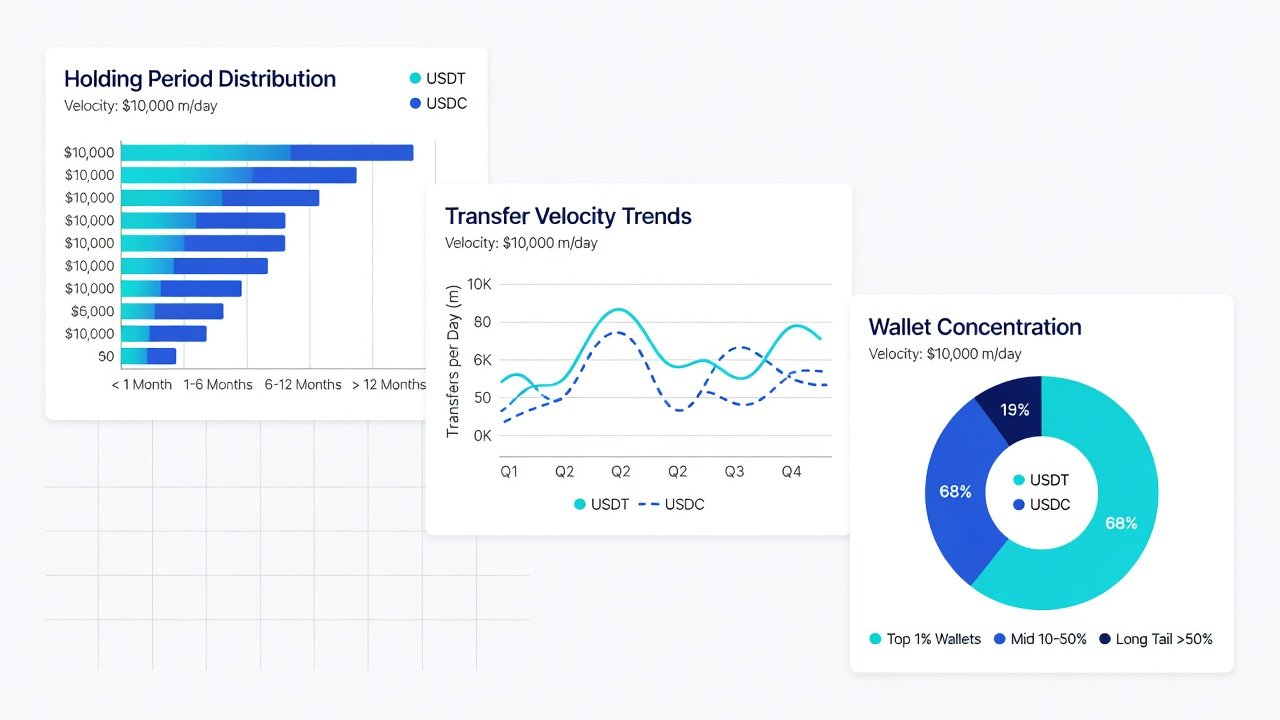
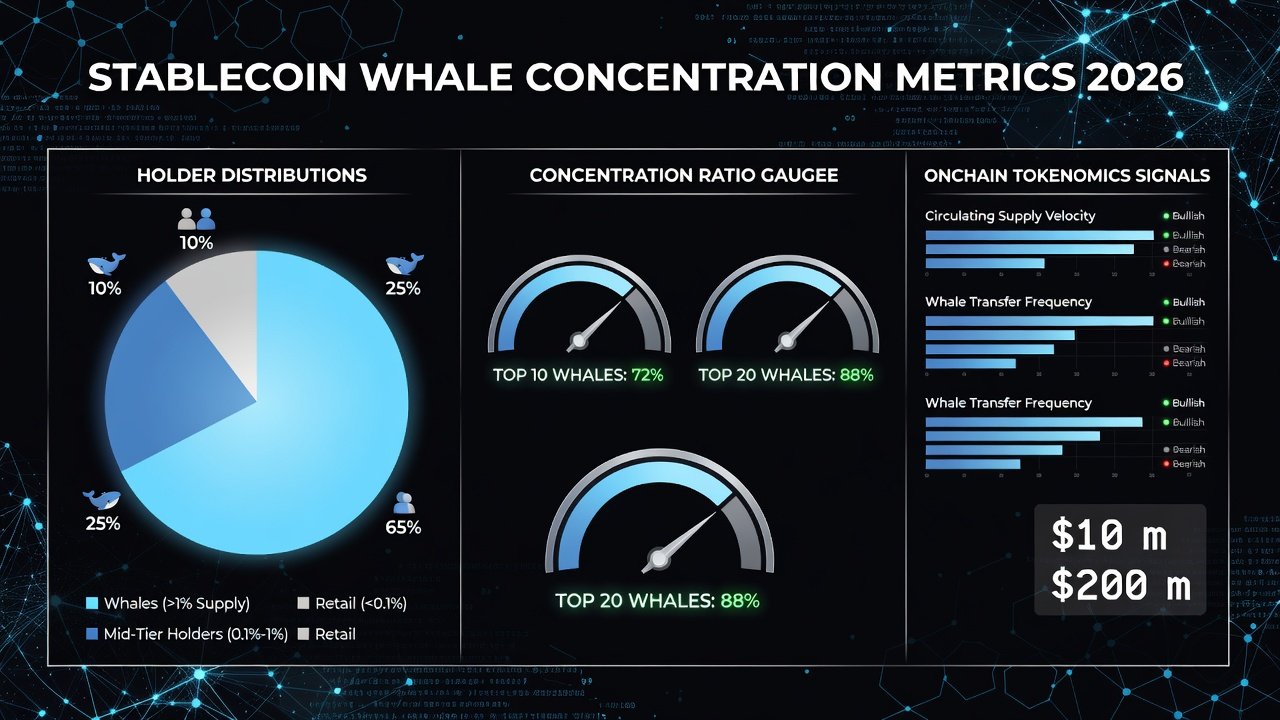
Stablecoins serve as the backbone of decentralized finance, facilitating trillions in annual volume. Onchain data reveals nuanced behaviors beyond simple supply figures. Wallet clustering identifies groups of addresses controlled by the same entity, often through common funding sources or transaction patterns. Holding periods measure the average time tokens remain in wallets before transfer, while transfer velocity tracks how frequently units move between addresses. Concentration shifts occur when large holders (whales) redistribute assets, potentially signaling liquidity events. These metrics, when combined, offer predictive power for demand forecasting and risk mitigation. For example, a sudden decrease in holding periods within a clustered group of addresses may indicate preparation for large-scale redemptions or transfers to exchanges.
Additional metrics worth tracking include active address growth and the distribution across different wallet size tiers. By segmenting data into small retail wallets under $10,000, mid-tier addresses, and large institutional holdings, analysts gain clearer visibility into market segments driving activity. In 2026, these layered insights have proven especially valuable for forecasting stablecoin inflows into lending protocols and automated market makers.
Practical Steps for Extracting Holder Metrics
Blockchain analytics tools make these insights accessible. Follow these steps to build your own analysis:
- Connect to public datasets on platforms like Dune Analytics using SQL queries focused on stablecoin contract addresses. Start by filtering transfer events for USDT and USDC on Ethereum and layer-two networks.
- Cluster wallets by analyzing shared transaction histories and labeling known entities such as exchanges or protocols. Use heuristics like common input addresses or repeated interaction patterns to group related wallets accurately.
- Calculate holding periods by tracking deposit and withdrawal timestamps per address cohort. Aggregate this data into daily or weekly averages for trend analysis.
- Measure velocity through daily transfer counts normalized by circulating supply. Compare results across different time windows to detect anomalies.
- Monitor concentration via Gini coefficients derived from balance distributions. Plot these over time to visualize shifts in ownership centralization.
Tools like Nansen or Arkham Intelligence provide pre-built dashboards for retail users, while advanced teams export raw data from node providers for custom modeling. Always validate clusters against publicly known labels to reduce false positives from mixer services or privacy tools.
Retail vs Institutional Holder Behaviors Compared
Retail holders typically exhibit shorter holding periods, often under 30 days, driven by trading or yield farming. In contrast, institutional wallets show longer average holds exceeding 90 days, reflecting treasury management and collateral use in lending protocols. Transfer velocity is markedly higher among retail clusters during volatility spikes, whereas institutions favor batch transfers to minimize fees. Concentration data from 2026 indicates institutions control over 60% of USDC supply in large wallets, compared to more fragmented USDT distribution favoring retail. These differences impact liquidity predictions: retail-driven velocity spikes often precede short-term demand surges in DeFi pools.
Further distinctions appear in chain preferences. Retail users frequently move USDT across Tron for lower fees, while institutions predominantly use USDC on Ethereum for its regulatory compliance features. Behavior during market stress also diverges, with retail wallets showing rapid outflows and institutions maintaining positions longer for strategic reasons.
Case Studies: Predicting Liquidity Events
One notable 2026 example involved a major USDT whale cluster reducing holdings ahead of a regulatory announcement, correlating with a 15% velocity increase across DeFi protocols. Analysts using onchain clustering flagged the shift days in advance, allowing protocols to adjust collateral ratios proactively. Another case from Circle’s USDC ecosystem showed institutional holding periods lengthening during Q2 2026, signaling stable demand that preceded successful integration into new payment rails. These insights helped mitigate risks by highlighting potential outflows before they materialized on centralized exchanges.
A third case study from a leading DeFi lending platform revealed how monitoring mid-tier wallet clusters helped predict a liquidity crunch. By observing a 40% rise in transfer velocity combined with shortening holding periods, the protocol increased reserve requirements and avoided a potential shortfall when large redemptions occurred.
Building Custom Dashboards: FAQs
How do I start querying stablecoin data?
Begin with free tiers on Dune or Flipside Crypto. Focus queries on ERC-20 transfer events filtered by USDT and USDC contract addresses. Expand to include cross-chain bridges for a fuller picture of holder movement.
What signals indicate an upcoming liquidity event?
Watch for simultaneous increases in velocity and decreases in average holding periods within whale clusters, often 48-72 hours before major outflows. Combine this with exchange inflow data for stronger confirmation.
Are there limitations to onchain analysis?
Yes, off-chain custody and mixer usage can obscure clusters. Always cross-reference with labeled data from reputable providers and consider privacy-enhancing technologies that may hide activity.
How can I integrate these metrics into automated alerts?
Use webhook integrations from analytics platforms to trigger notifications when velocity exceeds historical averages or when concentration metrics shift beyond defined thresholds.
Actionable Techniques for Forecasting and Risk Mitigation
Integrate holder metrics into your tokenomics models by setting alerts for velocity thresholds. Compare current patterns against historical baselines from 2025 to identify anomalies. For DeFi protocols, diversify stablecoin reserves based on observed concentration risks—favoring assets with balanced retail-institutional splits reduces single-point vulnerabilities. Regularly audit your dashboards for accuracy, incorporating new labels as entities evolve. This approach transforms raw onchain data into strategic foresight, enhancing both demand prediction and portfolio resilience.
Common mistakes to avoid include over-relying on single-chain data without accounting for bridges and ignoring small but numerous retail wallets that collectively influence velocity. Best practices involve maintaining rolling 30-day and 90-day baselines while stress-testing models against past events like the 2025 market corrections.
Future Outlook and Emerging Trends
Looking ahead, the integration of AI-driven clustering algorithms is expected to improve accuracy in identifying institutional behavior. Regulatory developments may also influence holding patterns as compliance-focused stablecoins gain traction. Tokenomics teams should prepare by building flexible dashboards that incorporate new data sources such as real-world asset collateral flows.
Conclusion
Stablecoin holder behavior analysis in 2026 underscores the power of onchain transparency. By mastering wallet clustering, holding periods, and velocity metrics, participants gain a competitive edge in navigating token economics. Apply these techniques consistently to stay ahead of liquidity dynamics and build more robust DeFi strategies.
No comments yet. Be the first!