 CryptoChain Blog

Introduction to Stablecoin Holder Cohort Analysis in 2026
Stablecoin holder cohort analysis has become essential for understanding tokenomics sustainability in the evolving onchain landscape of 2026. By segmenting wallets based on behavior, size, and activity patterns, analysts can move beyond simple whale tracking to reveal deeper insights into retention, velocity, and systemic risks. This approach helps DeFi analysts and token researchers identify how different holder groups influence liquidity, stability, and long-term viability of assets like USDT and USDC. In an era where stablecoins underpin much of decentralized finance, these insights provide a competitive edge for risk assessment and strategic decision-making.
Cohort analysis divides holders into groups that share common characteristics, such as acquisition date or holding size. In stablecoins like USDT and USDC, this reveals how different segments contribute to overall liquidity and stability. As regulatory scrutiny increases and DeFi matures, these insights help predict potential stress points before they impact broader markets. The methodology extends traditional financial analysis by leveraging transparent blockchain data, allowing for granular examination of wallet behaviors across multiple networks.
Practical Steps for Building Cohort Queries
Start by defining clear cohort criteria using onchain tools like Dune Analytics or custom SQL queries on blockchain data. Key steps include identifying wallet creation timestamps and initial deposit events from stablecoin smart contracts. Next, segment by balance tiers such as micro holders under typical retail thresholds, mid-tier participants, and large entities. Incorporate activity filters including transaction frequency, cross-chain bridges, and interactions with DeFi protocols like lending platforms or decentralized exchanges.
To build effective queries, analysts should first extract raw event logs from stablecoin contracts on primary chains. Then apply time-based bucketing to group wallets by onboarding periods, such as those acquired in Q1 versus later quarters. Incorporate velocity proxies by calculating average holding periods within each cohort. Real-world examples include querying for wallets that bridged funds from Ethereum to Tron and tracking their subsequent activity patterns. These queries allow precise tracking of how cohorts evolve, providing a foundation for velocity calculations that measure how quickly tokens circulate within each group. Refining queries iteratively helps eliminate noise from dormant or bot-driven wallets, ensuring cleaner data for downstream analysis.
Tracking Retention and Velocity Across Cohorts
Retention measures the percentage of wallets remaining active over time, while velocity indicates turnover rate. High retention in large-holder cohorts signals confidence in the stablecoin, whereas low velocity in retail segments may point to hoarding behaviors that reduce liquidity efficiency. To track these metrics effectively, calculate cohort-specific retention as the ratio of active wallets at the end of a period to those at the start. Velocity can be derived by dividing total transaction volume by the average cohort balance over the same timeframe.
Interpreting impacts on tokenomics requires comparing these figures across groups. For instance, a cohort showing declining retention alongside rising velocity might indicate speculative trading rather than stable usage. Analysts often layer in additional dimensions such as geographic proxies derived from bridge patterns or protocol interactions. This multi-faceted tracking reveals whether stablecoin supply is being utilized productively or merely parked, directly affecting overall ecosystem sustainability and resilience against external shocks.
USDT and USDC Case Studies with Real Metrics
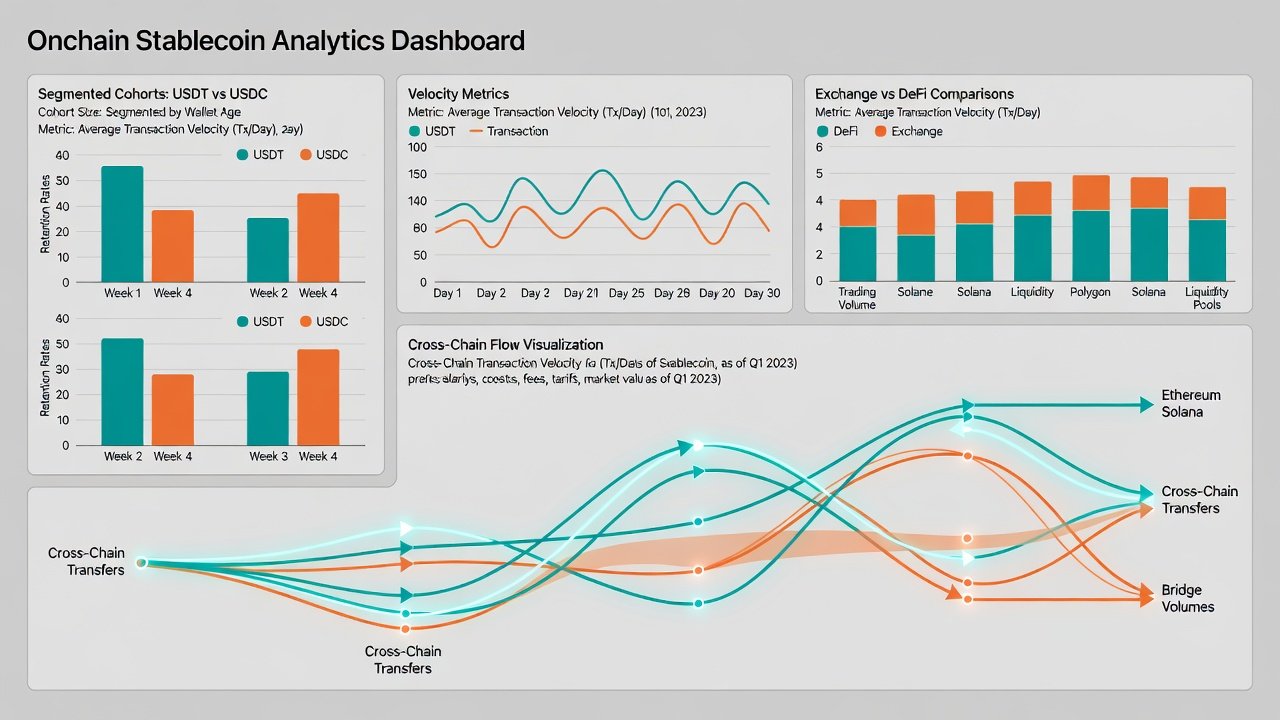
Examining USDT and USDC through cohort lenses highlights distinct patterns. USDT often shows stronger concentration in exchange-linked wallets, reflecting its role in trading pairs, while USDC demonstrates higher DeFi integration with more diversified holder behaviors. In practice, cohort breakdowns for USDT reveal heavier weighting toward short-term trading segments, leading to elevated velocity in those groups. USDC cohorts, however, frequently display steadier retention rates among DeFi participants who engage in yield-generating activities.
Comparisons reveal that exchange-heavy cohorts in USDT exhibit faster velocity but lower long-term retention compared to DeFi-focused USDC segments. Analysts should monitor shifts in these distributions to anticipate liquidity squeezes. Detailed case studies involve mapping cohort migration during periods of market stress, noting how USDT large-holder groups respond differently from USDC's retail base. These real metrics underscore the importance of context-specific analysis rather than applying blanket assumptions across stablecoin types.
Exchange Versus DeFi Holders: Key Comparisons
Exchange holders typically prioritize short-term trading, leading to higher transaction counts but variable retention. DeFi holders, by contrast, engage in lending, liquidity provision, and yield farming, resulting in steadier activity patterns but exposure to protocol risks. Cross-comparisons show DeFi cohorts often maintain better retention during market volatility due to locked positions, whereas exchange cohorts react more sharply to price movements in paired assets.
Further analysis can include examining overlap between exchange and DeFi activities, such as wallets that move funds from centralized platforms to decentralized protocols. This reveals hybrid behaviors that traditional segmentation might miss. Understanding these differences aids in forecasting supply dynamics and identifying which holder types drive sustainable usage versus transient flows.
Red Flags for Concentration Risks
Watch for over-concentration where top cohorts control disproportionate supply shares. This includes sudden migrations between chains or rapid depletion of retail cohorts. Such signals can indicate emerging systemic vulnerabilities in stablecoin ecosystems. Additional red flags involve clustering of activity around specific protocols or unexpected spikes in cross-border flows that deviate from historical norms.
Analysts should implement monitoring thresholds, such as when a single cohort exceeds 30 percent of circulating supply, to trigger deeper investigations. Historical patterns from past market events demonstrate how unchecked concentration can amplify depeg risks or liquidity crises, making proactive identification critical for risk management frameworks.
Workflows for Custom Dashboards and Cross-Chain Flow Tracking
Build dashboards by combining data from multiple chains using tools that aggregate bridge activity. Track flows by monitoring deposit and withdrawal events across networks like Ethereum, Tron, and Solana. Automate alerts for cohort migration thresholds to enable proactive risk assessment. A typical workflow begins with data ingestion from primary explorers, followed by cohort labeling via tagging scripts, and visualization through interactive charts that update in near real time.
Cross-chain tracking adds complexity but provides comprehensive views by following stablecoin movements via bridge contracts. Integrate these into dashboards alongside retention and velocity metrics for holistic oversight. Regular audits of data pipelines ensure accuracy, while sharing anonymized cohort insights across teams can enhance collective understanding of tokenomics health.
FAQs on Applying Cohort Insights to Risk Assessment
- How often should cohorts be refreshed? Review queries weekly to capture emerging behavioral shifts and maintain relevance in fast-moving markets.
- What data sources are most reliable? Prioritize verified onchain explorers and analytics platforms with transparent methodologies, such as those offered by Dune Analytics and official issuer resources from Tether and Circle.
- Can insights predict depegging events? Cohort velocity spikes combined with concentration warnings have historically preceded stress periods, though they should be combined with broader market indicators.
- How do cross-chain flows affect cohort analysis? They can redistribute supply across ecosystems, altering retention profiles and requiring multi-chain data aggregation for accurate segmentation.
- What tools complement cohort tracking? Platforms like DeFiLlama provide supporting protocol-level data to contextualize holder behaviors.
By integrating these techniques, token researchers gain a robust framework for evaluating stablecoin health beyond surface-level metrics, supporting more informed decisions in portfolio management and protocol design.

No comments yet. Be the first!