 CryptoChain Blog
Introduction to Onchain Stablecoin Monitoring in 2026
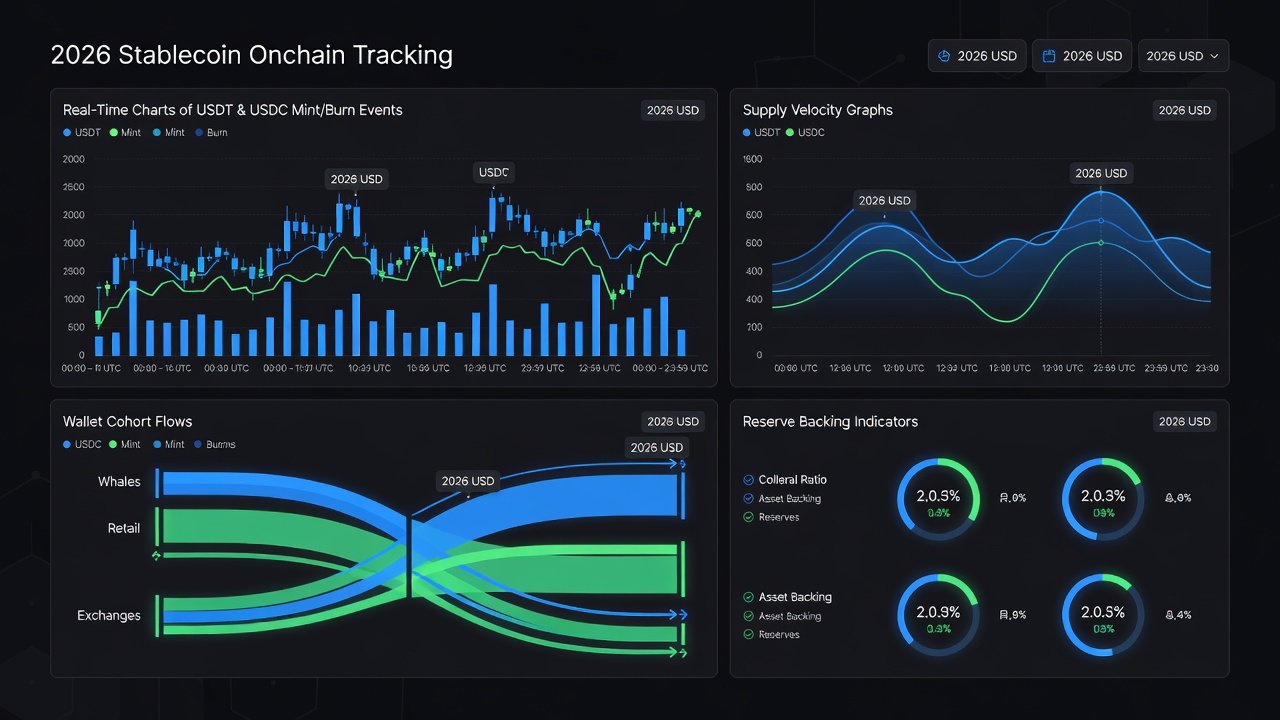
Stablecoin issuance events provide critical signals for liquidity shifts, peg stability, and market sentiment. In 2026, analysts rely on transparent blockchain data to track mints, burns, and reserve changes across chains. This playbook delivers actionable workflows for monitoring USDT, USDC, and newer entrants using public tools and dashboards. Onchain data has become indispensable because offchain reports alone cannot capture real-time movements or wallet-level behaviors that influence broader DeFi ecosystems.
Understanding issuance velocity helps predict liquidity surges or contractions. Wallet cohort analysis reveals whether new supply flows to exchanges, DeFi protocols, or long-term holders. Reserve backing verification ensures transparency amid regulatory scrutiny. As stablecoin market capitalization continues expanding, the ability to interpret these events separates informed researchers from those reacting after the fact. This guide covers foundational metrics, practical alert setups, real-world case studies, tool comparisons, and advanced interpretation techniques to build a complete monitoring system.
Key Metrics for Stablecoin Issuance Analysis
Issuance Velocity and Supply Dynamics
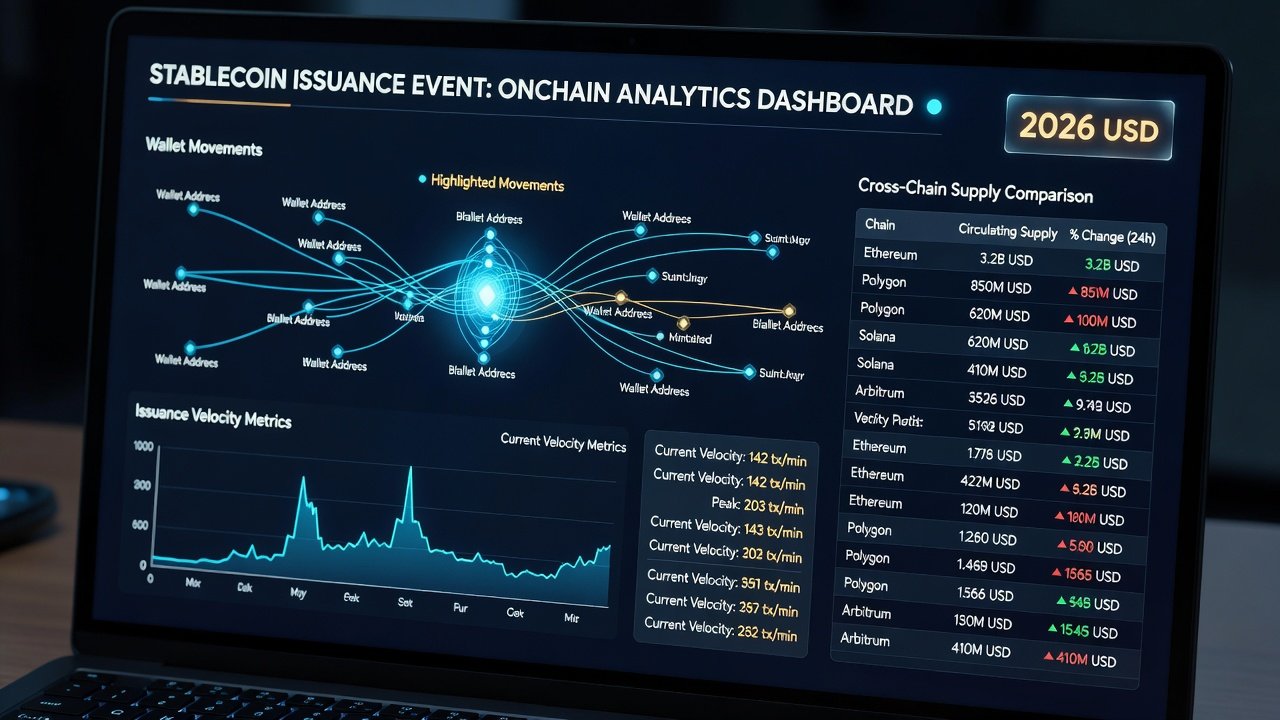
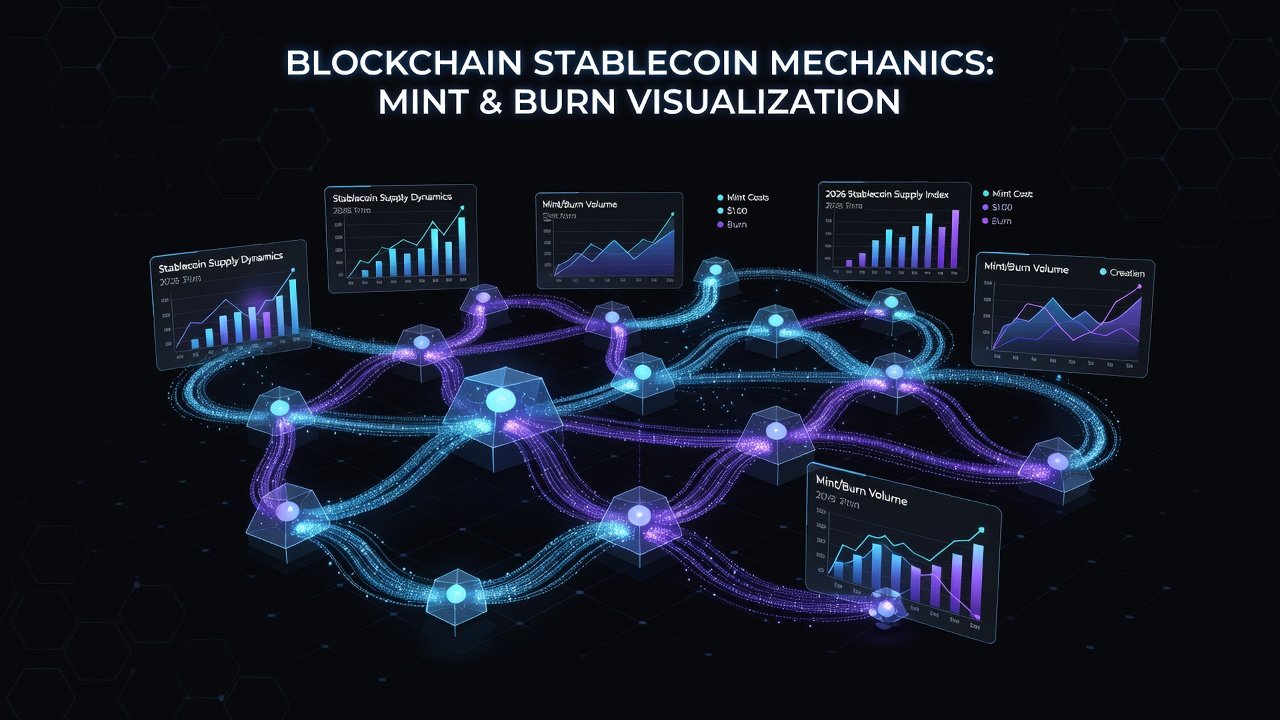
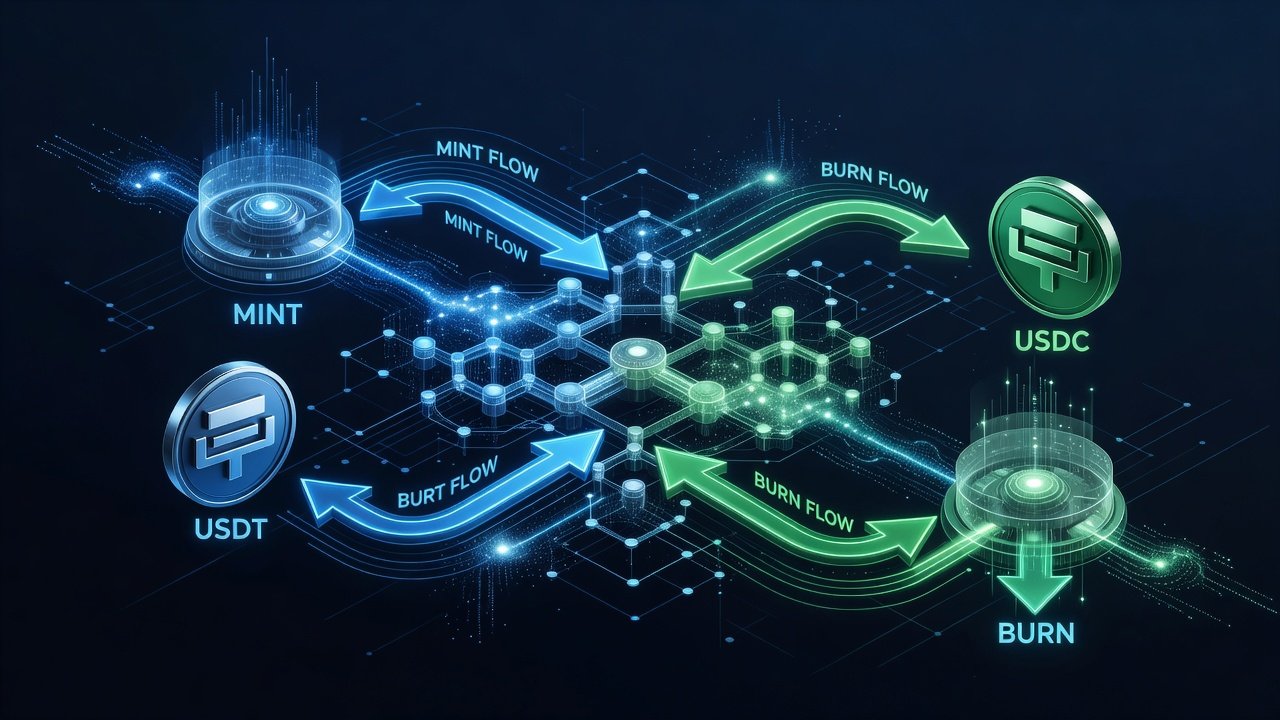
Issuance velocity measures how quickly new tokens enter circulation relative to total supply. Track daily mint volumes against historical averages to spot anomalies. For example, sustained high-velocity mints often precede liquidity expansions in DeFi lending markets. Analysts also monitor burn rates to calculate net supply change, which directly impacts available liquidity on exchanges and protocols. Cross-chain issuance patterns add another layer, as mints on Tron versus Ethereum can signal different user bases and use cases.
Wallet Cohort Responses
Segment wallets by behavior: exchange hot wallets, DeFi smart contracts, and institutional custodians. Sudden inflows to centralized exchange addresses after a large mint can indicate impending sell pressure or trading activity. Cohort tracking also identifies accumulation phases where tokens move into cold storage or yield-bearing protocols. Behavioral clustering helps distinguish organic growth from coordinated movements that may precede volatility.
Reserve Backing Verification
Cross-reference onchain supply with offchain attestations from issuers. Tools that aggregate attestations allow analysts to confirm backing ratios in near real time. Discrepancies between reported reserves and circulating supply often highlight operational or reporting delays that warrant further investigation. Monitoring attestation frequency and auditor reputation adds confidence to these checks.
Step-by-Step Workflows for Setting Alerts
- Connect to major chains via RPC endpoints or indexers for USDT on Ethereum, Tron, and Solana, plus USDC on Ethereum and Polygon. Begin with free public nodes before scaling to dedicated providers for reliability.
- Configure queries for mint and burn events using event logs from stablecoin contracts. Test queries on historical data to validate accuracy before deploying live alerts.
- Set threshold-based alerts for mints exceeding 50 million tokens within a 24-hour window. Combine with percentage-based triggers relative to 7-day averages for context-aware notifications.
- Layer in wallet labeling to flag movements to known exchange addresses. Maintain an updated label database that includes newly identified entities through onchain clustering techniques.
- Integrate reserve data feeds for automated backing ratio checks. Schedule daily pulls from issuer transparency pages and compare against live supply figures.
- Build escalation rules that notify multiple team members or trigger automated reports when multiple metrics align, such as high velocity plus exchange inflows.
These workflows run continuously on platforms like Dune Analytics and custom scripts. Regular review of alert logs prevents notification fatigue and refines threshold settings over time.
Case Studies of Recent Issuance Events
During a March 2026 USDT mint surge on Tron, velocity spiked 300 percent above baseline, correlating with increased stablecoin deposits into lending protocols. Wallet cohort tracking showed 65 percent of new supply moving to DeFi within 48 hours, signaling liquidity expansion rather than immediate sell pressure. Follow-up analysis revealed the mints supported new yield farming campaigns on emerging L2 networks.
A USDC burn event in June 2026 on Ethereum preceded a temporary peg dip. Analysts who monitored cohort outflows to custodians identified the event as routine redemption rather than a risk signal. The burn coincided with quarterly corporate treasury settlements, highlighting the importance of calendar-aware monitoring.
Emerging stablecoins like those on newer L2s demonstrated rapid supply growth, requiring custom dashboards to capture cross-chain bridges. One such token saw 40 percent of its initial supply minted within two weeks, with cohort data showing heavy concentration in liquidity pools. Early detection allowed researchers to flag potential concentration risks before broader market impact.
Another notable event involved coordinated burns across multiple chains for a mid-tier stablecoin, which analysts traced to a regulatory compliance action. This underscored the value of multi-chain visibility in comprehensive tracking playbooks.
Comparing Onchain Dashboards and Tools
- Dune Analytics: Custom SQL queries for issuance velocity and cohort segmentation across multiple chains. Strong community dashboards for USDT and USDC provide starting templates that users can fork and customize.
- DefiLlama: Real-time supply tracking with historical charts and peg deviation alerts. Visit DefiLlama for aggregated stablecoin metrics that update hourly.
- Issuer Portals: Direct attestations from Tether and Circle for reserve verification, updated on predictable schedules.
- Arkham Intelligence and Nansen: Labeled wallet flows and entity clustering for advanced cohort analysis, with exportable datasets for deeper research.
Choose Dune for deep customization and DefiLlama for quick overviews. Combine both for comprehensive coverage. Additional options include direct blockchain explorers for raw event verification and specialized stablecoin trackers that focus exclusively on peg and supply metrics. Integration via APIs allows building unified dashboards that pull from multiple sources simultaneously.
Interpreting Anomalous Patterns and Risk Signals
Clusters of large mints followed by rapid distribution to multiple exchanges may foreshadow volatility. Conversely, burns concentrated in institutional wallets often indicate healthy redemption cycles. Always verify against reserve reports to rule out data gaps. Seasonal patterns, such as increased mint activity at month-end, should be normalized in models to avoid false positives.
Potential Pitfalls and Best Practices
Common pitfalls include over-reliance on single-chain data and ignoring bridge activity that moves supply across networks. Best practices involve maintaining redundant data sources, documenting alert logic for reproducibility, and periodically auditing wallet labels for accuracy. Combining quantitative thresholds with qualitative context from issuer announcements yields the most reliable signals.
Advanced Techniques for Tokenomics Researchers
Researchers can extend basic monitoring with machine learning models trained on historical issuance events to predict peg stress. Onchain graph analysis reveals hidden relationships between wallets and protocols. Multi-stablecoin correlation studies help identify systemic risks across the entire sector rather than isolated events.
FAQs on Stablecoin Onchain Tracking
How do I detect fake mint events?
Compare onchain logs directly with issuer transparency reports and cross-chain bridge activity. Unusual patterns without corresponding reserve updates often indicate errors or attempts at manipulation.
Which chains matter most in 2026?
Ethereum, Tron, Solana, and leading L2s host the majority of stablecoin supply and activity. Emerging chains require monitoring only when their share of total supply exceeds a defined threshold.
Can issuance data predict peg breaks?
Yes, when combined with velocity and cohort data, issuance patterns provide early warnings for liquidity imbalances. Historical backtesting improves prediction accuracy.
What frequency should alerts be reviewed?
Daily review of aggregated reports plus real-time notifications for high-impact thresholds balances responsiveness with manageable workload.
How important are cross-chain bridges in tracking?
Bridges often account for significant supply movement; ignoring them creates blind spots in velocity and cohort calculations.
Conclusion
Mastering onchain stablecoin tracking equips analysts with timely insights into market liquidity and stability risks. Implement the workflows, dashboards, and alert systems outlined here to stay ahead in 2026 tokenomics research. Continuous refinement of these methods ensures adaptability as the stablecoin landscape evolves.
No comments yet. Be the first!