 CryptoChain Blog
Introduction to Stablecoin Mint and Burn Mechanics in 2026
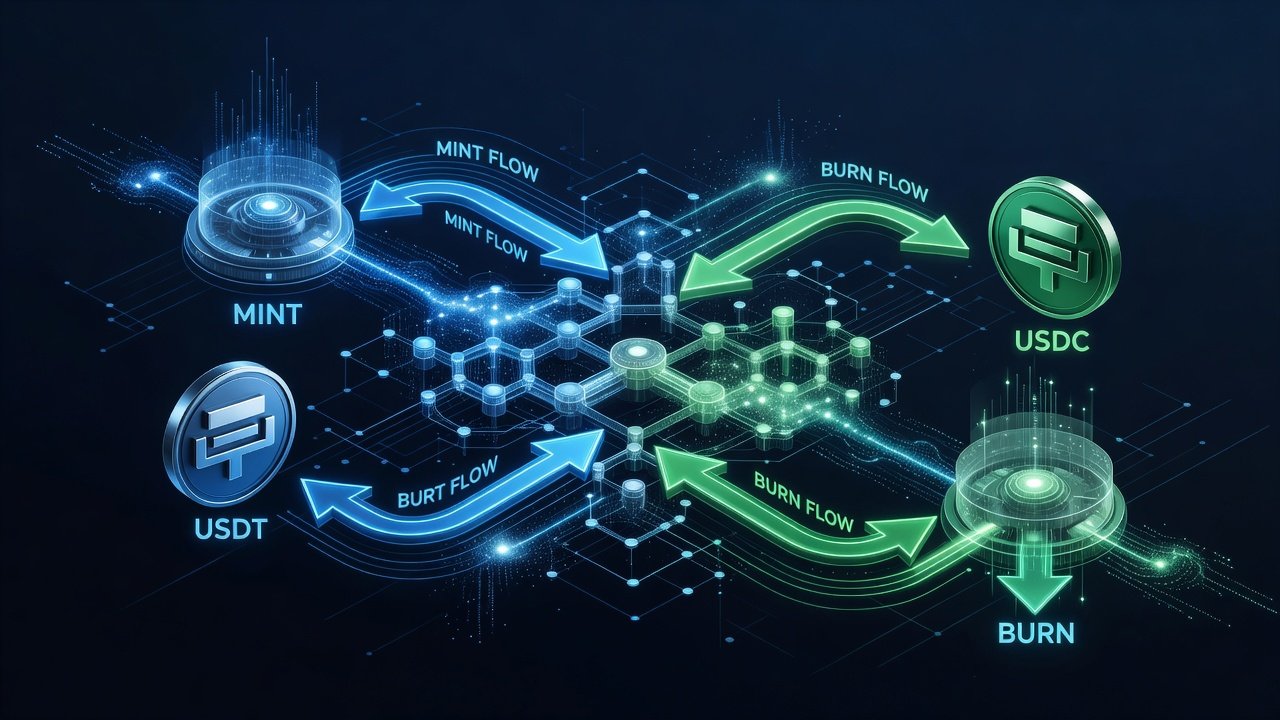
Stablecoin mint and burn flows remain central to tokenomics analysis in 2026. These mechanisms directly control circulating supply, influence velocity, and serve as primary tools for maintaining peg stability across assets like USDT and USDC. Analysts now rely on real-time onchain data to interpret issuance events and redemption queues rather than relying solely on off-chain reports. Minting increases supply when users or institutions deposit reserves with issuers, while burning reduces supply during redemptions. Monitoring these events reveals capital inflows, institutional demand shifts, and potential stress signals in the broader DeFi ecosystem. In 2026, with total stablecoin market capitalization exceeding previous years, understanding these flows has become essential for risk managers, traders, and protocol developers seeking to anticipate market movements.
The interplay between mint events and burn activity also affects liquidity pools, lending rates, and collateralization ratios across DeFi platforms. For instance, a sudden wave of mints can flood specific chains with liquidity, lowering borrowing costs temporarily, whereas coordinated burns may tighten available capital and push yields higher. This playbook expands on velocity and peg defense concepts by placing mint and burn mechanics at the core of 2026 tokenomics analysis.
Tracking Issuance Events and Redemption Queues Onchain
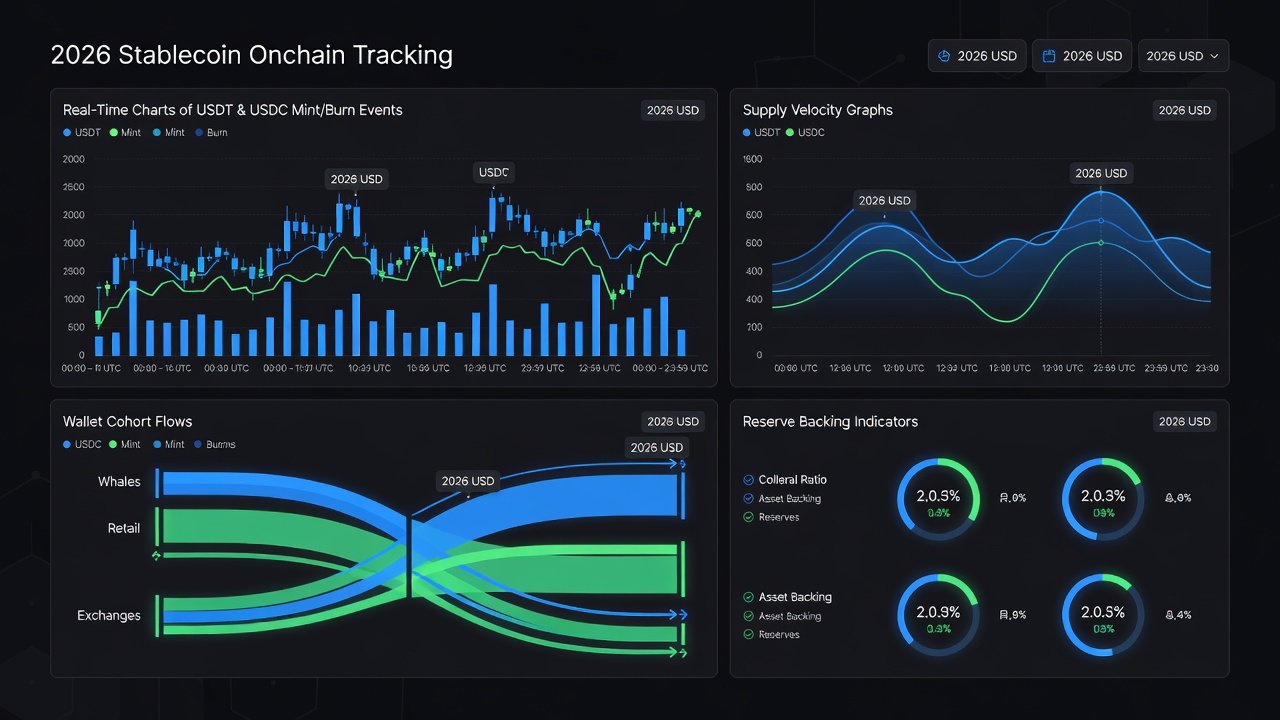
Real-time monitoring starts with issuer smart contracts and treasury wallets. For USDC, Circle publishes transparent attestations while onchain activity appears through the USDC contract on Ethereum and other chains. Tether similarly exposes mint and burn transactions via the USDT contract addresses. Redemption queues often surface as large transfers from exchange hot wallets to issuer reserve addresses. Cross-referencing these with stablecoin velocity metrics helps quantify how quickly new supply circulates or exits the system. Advanced analysts also monitor pending transaction mempools for early signals of large redemptions before they confirm onchain.
Additional data layers include monitoring event logs emitted by the contracts themselves, which contain precise amounts, timestamps, and sender addresses. Combining these with off-chain oracle feeds allows correlation of fiat banking movements with onchain actions. This multi-layered approach reduces blind spots that single-source monitoring inevitably creates.
Impact on Supply Velocity Using USDT and USDC Examples
Supply velocity measures how frequently each stablecoin unit changes hands. Large mint events can temporarily suppress velocity if the new supply sits in treasury wallets before deployment. Conversely, rapid burns following redemptions often signal deleveraging that can increase velocity among remaining holders. In 2026 examples, USDC mints tied to institutional treasury inflows showed velocity recovery within 48 hours when paired with lending protocol deposits. USDT burns during regional banking stress periods correlated with short-term velocity spikes on Tron and Ethereum. These patterns demonstrate that velocity is not static but responds dynamically to both issuance timing and destination wallet behavior.
Further analysis reveals that velocity tends to accelerate when minted stablecoins flow into automated market makers or yield aggregators rather than remaining in cold storage. Tracking the first three hops after a mint event provides reliable leading indicators of whether the new supply will contribute to productive economic activity or remain dormant.
Circle and Tether both publish periodic reserve updates that analysts cross-reference with onchain flows.
Step-by-Step Workflow for Monitoring Wallet Cohorts
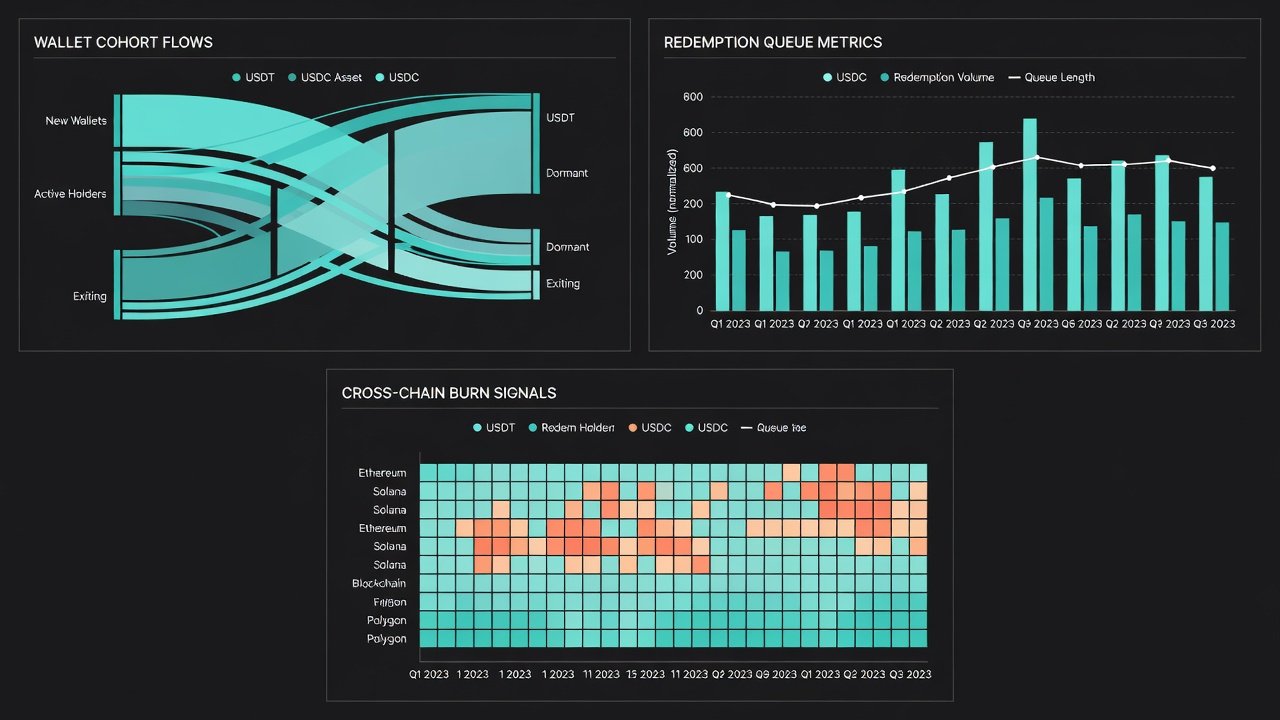
- Identify primary issuer reserve and minting contract addresses for USDT and USDC across Ethereum, Tron, and Solana.
- Segment wallets into cohorts: exchanges, lending protocols, OTC desks, and retail aggregators using labeling services.
- Track net flows between cohorts over rolling 7-day and 30-day windows.
- Correlate cohort movements with reserve attestation dates to spot timing discrepancies.
- Export data into dashboards for velocity calculations and anomaly detection.
- Apply machine learning clustering to identify previously unknown wallet groups that exhibit similar mint or burn patterns.
- Backfill historical data to establish baseline behavior for each cohort during both bull and bear market regimes.
Cross-Chain Burn Signals and Reserve Correlation Metrics
Cross-chain burns provide early warnings of capital rotation. A large USDT burn on Ethereum followed by a mint on Tron often indicates migration rather than net redemption. Reserve correlation metrics compare attested backing assets against observed onchain supply changes. Analysts calculate daily divergence scores by subtracting reported reserves from verified circulating supply. Persistent positive divergence may flag delayed attestations or unreported liabilities. In practice, maintaining a 48-hour rolling correlation window helps filter noise from legitimate settlement delays.
Additional metrics include the ratio of burn-to-mint events per chain and the average time between burn confirmation and reserve attestation updates. These indicators become particularly valuable during periods of high market volatility when traditional financial reporting lags behind onchain reality.
Building Alerts for Unusual Mint Activity
Effective alert systems combine onchain event listeners with threshold rules. Set triggers for mint volumes exceeding the 30-day average by 300 percent within a single hour. Additional rules can flag mints originating from previously inactive wallets or those routed through mixers. Webhook integrations with tools such as Dune Analytics or custom RPC listeners deliver notifications to Slack or Telegram channels used by DeFi risk teams. Backtest alert parameters against historical 2025 events to reduce false positives. Consider layering multiple conditions, such as combining volume thresholds with wallet age or transaction fee anomalies, to improve signal quality.
Interpreting Impacts on Peg Stability
Peg deviations often follow large net burns when redemption pressure exceeds available liquidity. Conversely, aggressive minting without corresponding demand can create temporary oversupply that weakens the peg from above. Monitor the spread between onchain mid-market prices and issuer redemption rates. When spreads widen beyond 0.05 percent for more than four hours, it frequently precedes either a corrective mint or burn wave. Analysts should also watch funding rates on perpetual futures markets, as these often move in tandem with stablecoin peg pressure.
Case Studies from Recent 2026 Events
During the March 2026 liquidity event, a 1.2 billion USDC mint on Ethereum preceded a 0.8 billion burn on Solana within 36 hours. Onchain cohort analysis showed the minted supply moved into three major lending protocols before partial redemption. The velocity spike that followed indicated rapid deployment into leveraged positions. In June 2026, Tether executed successive burns totaling 650 million USDT across Tron after a regional exchange outage. Velocity metrics spiked 22 percent in the following week as remaining supply rotated into yield-bearing positions. A third case in September 2026 involved coordinated USDC mints across three chains totaling over 900 million, which analysts traced to a single institutional treasury rebalancing event using cohort flow mapping.
FAQ on Common Tracking Pitfalls for DeFi Analysts
How do I distinguish legitimate mints from potential wash activity?
Cross-check transaction provenance against known OTC and exchange labels. Legitimate institutional mints typically originate from whitelisted addresses with multi-signature controls. Sudden mints from unlabeled wallets warrant additional scrutiny of the preceding fiat on-ramp transactions.
Why do cross-chain burns sometimes appear delayed?
Bridge settlement times and batch processing at issuer level can create 15- to 90-minute lags between observed burn and reflected reserve adjustments. Always allow for these operational delays before concluding that a burn represents a true redemption.
What data sources provide the most reliable reserve correlation?
Combine issuer attestations with onchain supply data from multiple indexers. Divergence alerts should trigger only when two independent sources confirm the mismatch. Relying on a single data provider increases the risk of false signals caused by indexing errors.
Conclusion
Mastering stablecoin mint and burn flows equips analysts with a powerful lens for 2026 tokenomics. By combining real-time onchain tracking, cohort segmentation, and targeted alerts, DeFi professionals can anticipate velocity shifts and peg pressures before they appear in headline metrics. Consistent application of these workflows turns raw blockchain data into actionable tokenomics intelligence that supports better risk management and strategic decision making across the ecosystem.

No comments yet. Be the first!